SOM cluster: 1593
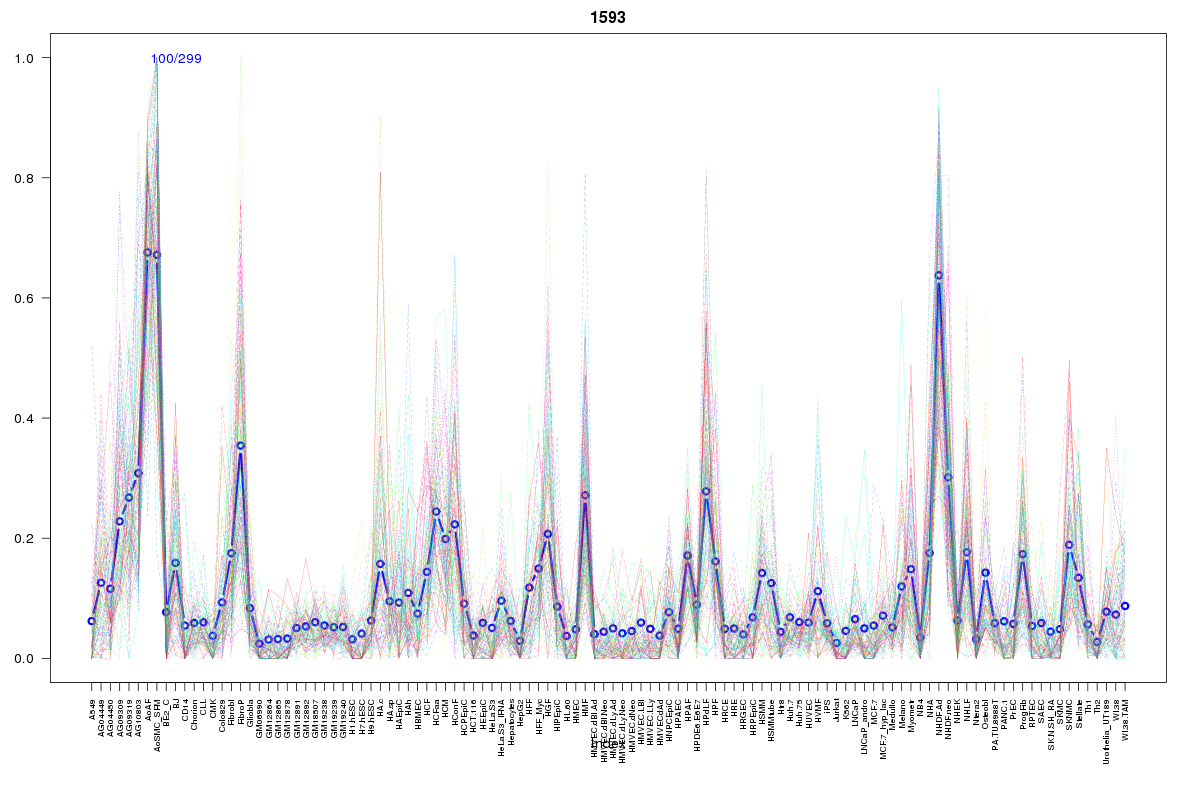
Cluster Hypersensitivity Profile

Genomic Location Trend
These plots show the distribution of the DHS sites surrounding the Transcript Start Site of the nearest gene.
Stats
Number of sites: 299Promoter: 0%
CpG-Island: 0%
Conserved: 48%
Enriched Motifs & Matches
No motifs found.BED file downloads
Top 10 Example Regions
| Location | Gene Link | Dist. |
|---|---|---|
| chr3: 156161840-156161990 | KCNAB1 | 46.27 |
| chr6: 16342905-16343055 | ATXN1 | 49.61 |
| chr1: 200494700-200494850 | KIF14 | 52.79 |
| chr1: 200494700-200494850 | DDX59 | 52.79 |
| chr7: 43652300-43652450 | HECW1 | 55.5 |
| chr12: 1915520-1915670 | LRTM2 | 57.02 |
| chr12: 1915520-1915670 | ADIPOR2 | 57.02 |
| chr14: 23117880-23118030 | ABHD4 | 60.03 |
| chr9: 91661880-91662030 | SHC3 | 60.8 |
| chr9: 91661880-91662030 | S1PR3 | 60.8 |