SOM cluster: 1603
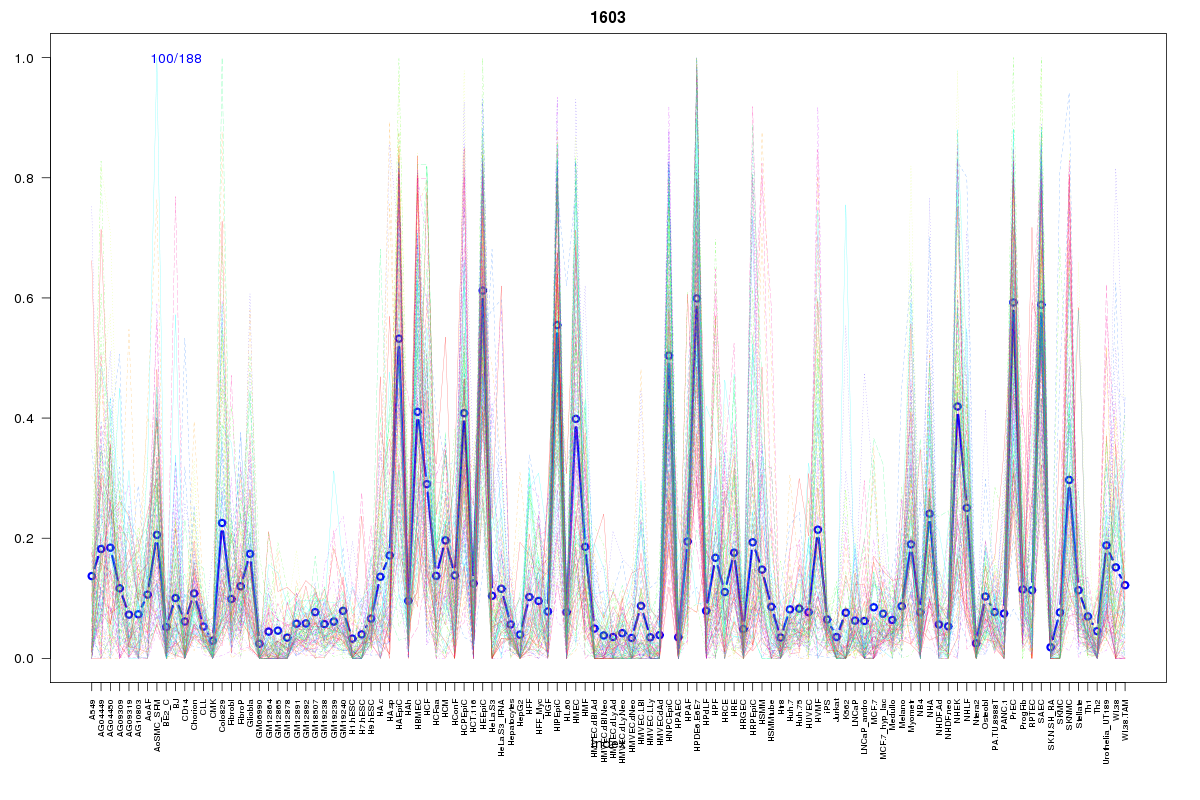
Cluster Hypersensitivity Profile

Genomic Location Trend
These plots show the distribution of the DHS sites surrounding the Transcript Start Site of the nearest gene.
Stats
Number of sites: 188Promoter: 0%
CpG-Island: 0%
Conserved: 19%
Enriched Motifs & Matches
Match Detail: [Jaspar]
|
| ||
|---|---|---|
| Sites: 36/100 | e-val: 0.0000091 | ||
| Factor | e-val(match) | DB |
| AP1 | 0.0000000202 | JASPAR |
| NFE2L2 | 0.00000037146 | JASPAR |
| NFE2L1::MafG | 0.00058847 | JASPAR |
| Prrx2 | 0.035412 | JASPAR |
| Pax2 | 0.035734 | JASPAR |
BED file downloads
Top 10 Example Regions
| Location | Gene Link | Dist. |
|---|---|---|
| chr13: 103526140-103526290 | ERCC5 | 36.87 |
| chr1: 192876800-192876950 | ZNF101P2 | 41.87 |
| chr1: 192876800-192876950 | LINC01032 | 41.87 |
| chr1: 192876800-192876950 | RGS2 | 41.87 |
| chr2: 3668480-3668630 | RNASEH1-AS1 | 52.19 |
| chr6: 28553240-28553390 | GPX6 | 58.26 |
| chr6: 28553240-28553390 | LINC00533 | 58.26 |
| chr12: 95595220-95595370 | VEZT | 63.77 |
| chr12: 95595220-95595370 | FGD6 | 63.77 |
| chr6: 91177820-91177970 | MAP3K7 | 65 |