SOM cluster: 1635
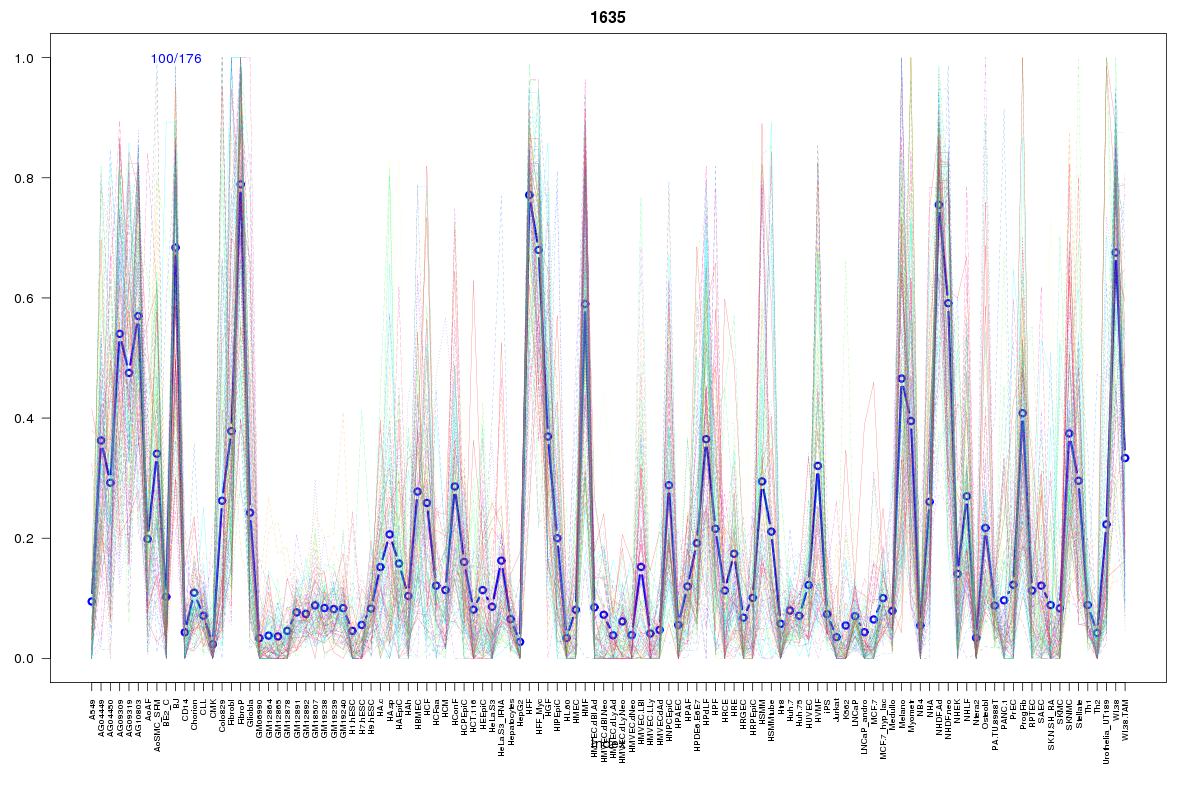
Cluster Hypersensitivity Profile

Genomic Location Trend
These plots show the distribution of the DHS sites surrounding the Transcript Start Site of the nearest gene.
Stats
Number of sites: 176Promoter: 3%
CpG-Island: 0%
Conserved: 40%
Enriched Motifs & Matches
Match Detail: [Jaspar]
|
| ||
|---|---|---|
| Sites: 37/100 | e-val: 0.000000004 | ||
| Factor | e-val(match) | DB |
| NFE2L2 | 0.000000022574 | JASPAR |
| AP1 | 0.0000017618 | JASPAR |
| NKX3-1 | 0.00029201 | JASPAR |
| Pdx1 | 0.0015991 | JASPAR |
| HOXA5 | 0.0053197 | JASPAR |
|
| ||
| Sites: 14/100 | e-val: 0.55 | ||
| Factor | e-val(match) | DB |
| IRF2 | 0.0000028696 | JASPAR |
| IRF1 | 0.000059891 | JASPAR |
| FOXO3 | 0.00019016 | JASPAR |
| SPIB | 0.00025256 | JASPAR |
| NFATC2 | 0.00030453 | JASPAR |
BED file downloads
Top 10 Example Regions
| Location | Gene Link | Dist. |
|---|---|---|
| chr9: 133895360-133895510 | FIBCD1 | 39.99 |
| chr3: 135787660-135787810 | PPP2R3A | 54.36 |
| chr1: 66899940-66900090 | SGIP1 | 63.38 |
| chr2: 230205240-230205390 | PID1 | 63.95 |
| chr20: 39847260-39847410 | TOP1 | 64.11 |
| chr20: 39847260-39847410 | RP1-1J6.2 | 64.11 |
| chr20: 39847260-39847410 | ZHX3 | 64.11 |
| chr18: 21108680-21108830 | ANKRD29 | 64.67 |
| chr3: 37276580-37276730 | LRRFIP2 | 65.89 |
| chr8: 13219620-13219770 | DLC1 | 67.38 |