SOM cluster: 1652
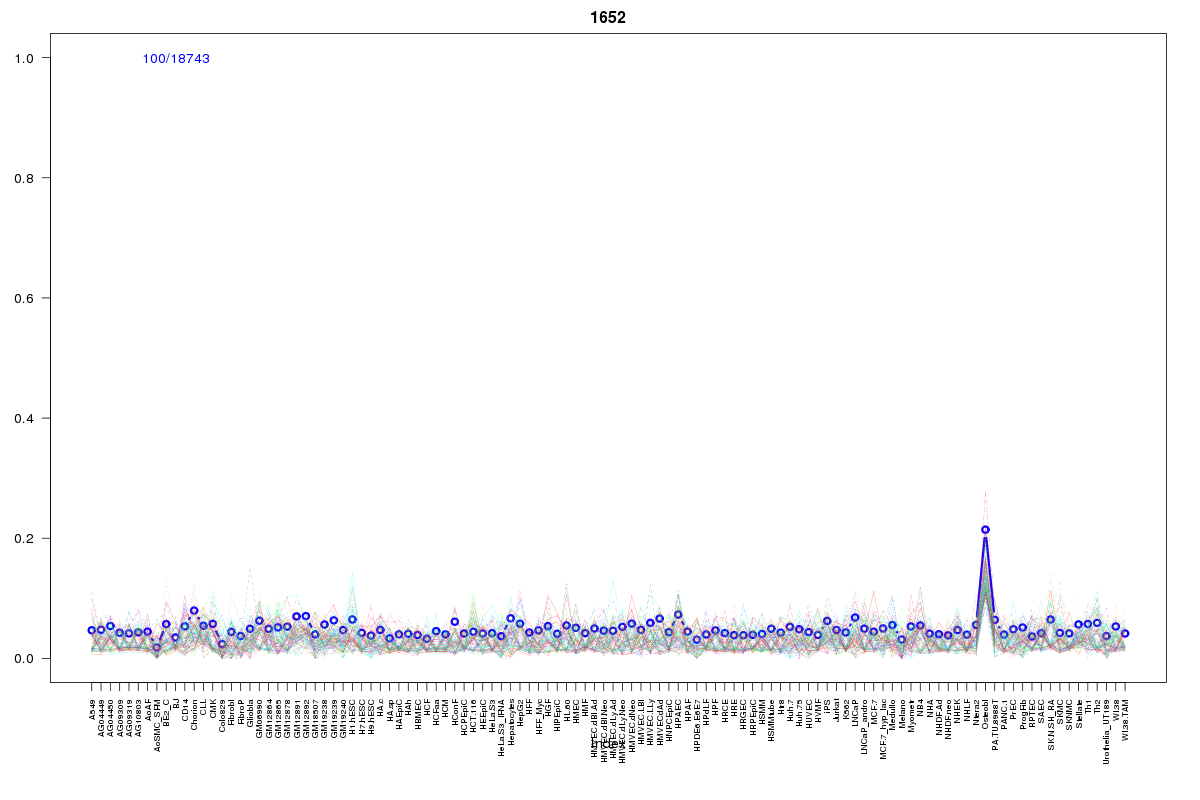
Cluster Hypersensitivity Profile

Genomic Location Trend
These plots show the distribution of the DHS sites surrounding the Transcript Start Site of the nearest gene.
Stats
Number of sites: 18743Promoter: 3%
CpG-Island: 1%
Conserved: 19%
Enriched Motifs & Matches
Match Detail: [Jaspar]
|
| ||
|---|---|---|
| Sites: 35/100 | e-val: 0.0000024 | ||
| Factor | e-val(match) | DB |
| PLAG1 | 0.00000233 | JASPAR |
| SP1 | 0.0000094811 | JASPAR |
| TFAP2A | 0.00033105 | JASPAR |
| INSM1 | 0.00047612 | JASPAR |
| Egr1 | 0.0010041 | JASPAR |
BED file downloads
Top 10 Example Regions
| Location | Gene Link | Dist. |
|---|---|---|
| chrX: 152902705-152902855 | DUSP9 | 34.27 |
| chr22: 19736385-19736535 | SEPT5 | 36.74 |
| chr22: 19736385-19736535 | GP1BB | 36.74 |
| chr1: 159901240-159901390 | VSIG8 | 37.32 |
| chr7: 65552765-65552915 | RP5-1132H15.2 | 38.02 |
| chr1: 1276560-1276710 | RP4-758J18.10 | 40.49 |
| chr9: 109807145-109807295 | RP11-196I18.4 | 41.27 |
| chr20: 50300385-50300535 | RP5-827A12.2 | 43.27 |
| chr16: 89110840-89110990 | ACSF3 | 43.7 |
| chr7: 47868245-47868395 | LINC00525 | 45.71 |