SOM cluster: 1660
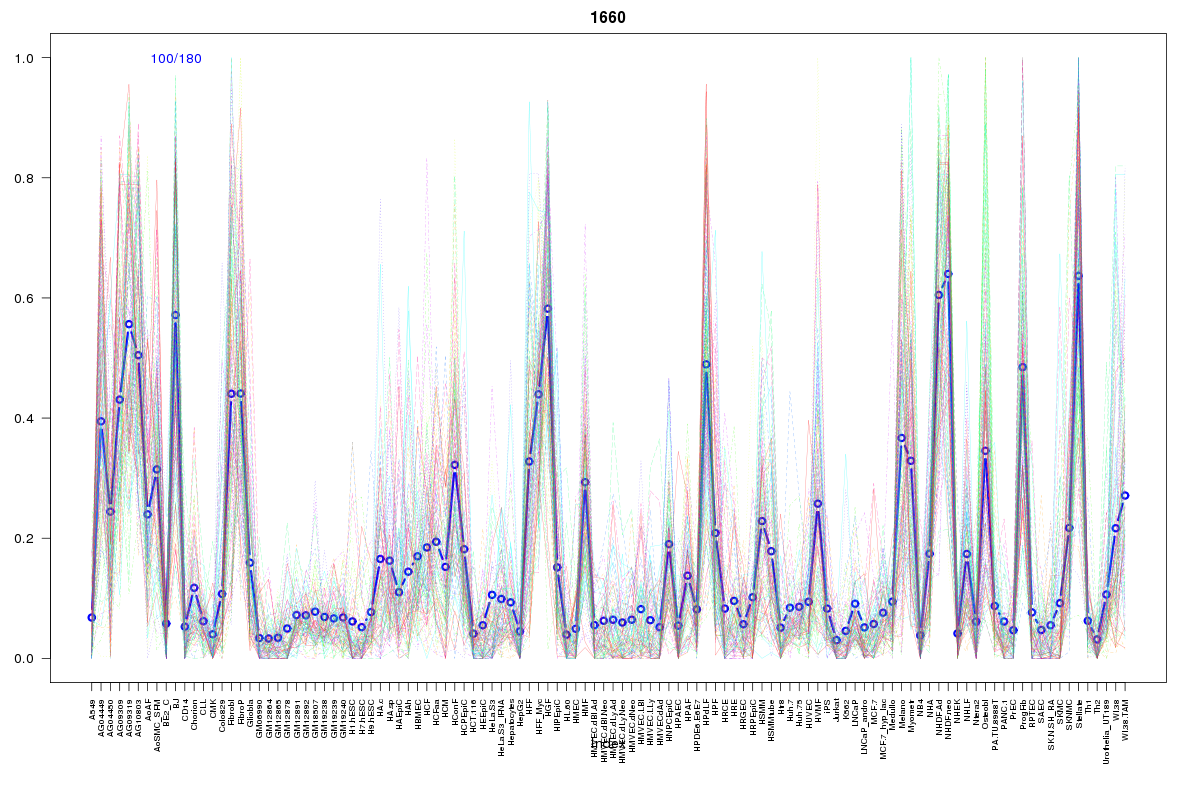
Cluster Hypersensitivity Profile

Genomic Location Trend
These plots show the distribution of the DHS sites surrounding the Transcript Start Site of the nearest gene.
Stats
Number of sites: 180Promoter: 1%
CpG-Island: 2%
Conserved: 46%
Enriched Motifs & Matches
Match Detail: [Jaspar]
|
| ||
|---|---|---|
| Sites: 35/100 | e-val: 0.0000000000000046 | ||
| Factor | e-val(match) | DB |
| Foxd3 | 0.0000029678 | JASPAR |
| Foxq1 | 0.00038151 | JASPAR |
| FOXI1 | 0.0026504 | JASPAR |
| Lhx3 | 0.0080512 | JASPAR |
| ARID3A | 0.012211 | JASPAR |
|
| ||
| Sites: 24/100 | e-val: 0.036 | ||
| Factor | e-val(match) | DB |
| MEF2A | 0.000039602 | JASPAR |
| Foxd3 | 0.00084137 | JASPAR |
| NKX3-1 | 0.012885 | JASPAR |
| FOXI1 | 0.016875 | JASPAR |
| Sox2 | 0.018595 | JASPAR |
BED file downloads
Top 10 Example Regions
| Location | Gene Link | Dist. |
|---|---|---|
| chr1: 1123460-1123610 | SDF4 | 29.85 |
| chr1: 1123460-1123610 | C1orf159 | 29.85 |
| chr1: 1123460-1123610 | MIR429 | 29.85 |
| chr9: 116935540-116935690 | COL27A1 | 54.92 |
| chr11: 128733180-128733330 | KCNJ5 | 56.92 |
| chr4: 169679905-169680055 | PALLD | 59.5 |
| chr4: 169679905-169680055 | RPL9P16 | 59.5 |
| chr8: 82470385-82470535 | FTH1P11 | 59.65 |
| chr8: 123828500-123828650 | RP11-44N11.1 | 61.13 |
| chr22: 19866580-19866730 | COMT | 62.72 |