SOM cluster: 1679
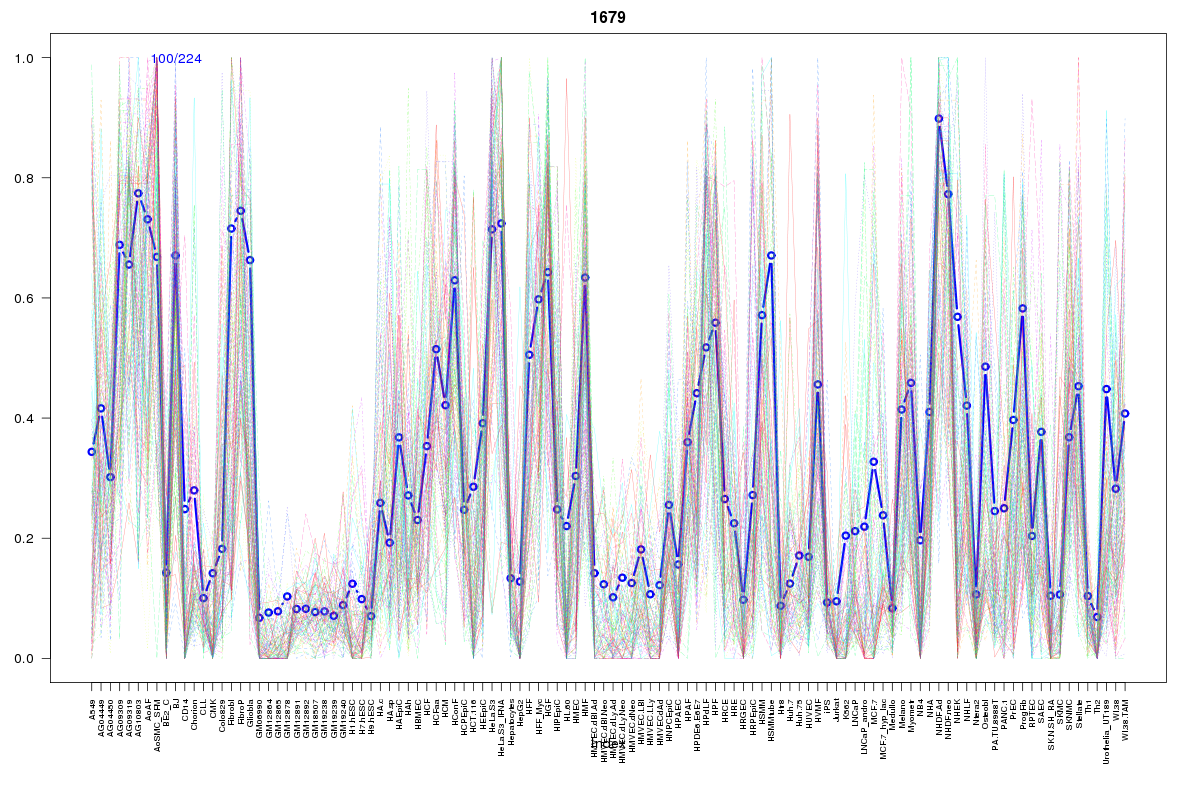
Cluster Hypersensitivity Profile

Genomic Location Trend
These plots show the distribution of the DHS sites surrounding the Transcript Start Site of the nearest gene.
Stats
Number of sites: 224Promoter: 4%
CpG-Island: 0%
Conserved: 50%
Enriched Motifs & Matches
Match Detail: [Jaspar]
|
| ||
|---|---|---|
| Sites: 23/100 | e-val: 1.9 | ||
| Factor | e-val(match) | DB |
| ARID3A | 0.00025762 | JASPAR |
| Lhx3 | 0.00048987 | JASPAR |
| AP1 | 0.0006422 | JASPAR |
| HNF1B | 0.00071647 | JASPAR |
| Foxq1 | 0.0016983 | JASPAR |
BED file downloads
Top 10 Example Regions
| Location | Gene Link | Dist. |
|---|---|---|
| chr1: 204462660-204462810 | RP11-430C7.2 | 32.45 |
| chr1: 203432140-203432290 | PRELP | 36.59 |
| chr2: 55173060-55173210 | RTN4 | 41.78 |
| chr9: 133669960-133670110 | ABL1 | 43.22 |
| chr12: 7167585-7167735 | C1R | 51.28 |
| chr12: 7167585-7167735 | SCARNA12 | 51.28 |
| chr12: 7167585-7167735 | PTPN6 | 51.28 |
| chr12: 7167585-7167735 | C1S | 51.28 |
| chr12: 7167585-7167735 | EMG1 | 51.28 |
| chr12: 7167585-7167735 | C1RL-AS1 | 51.28 |