SOM cluster: 1681
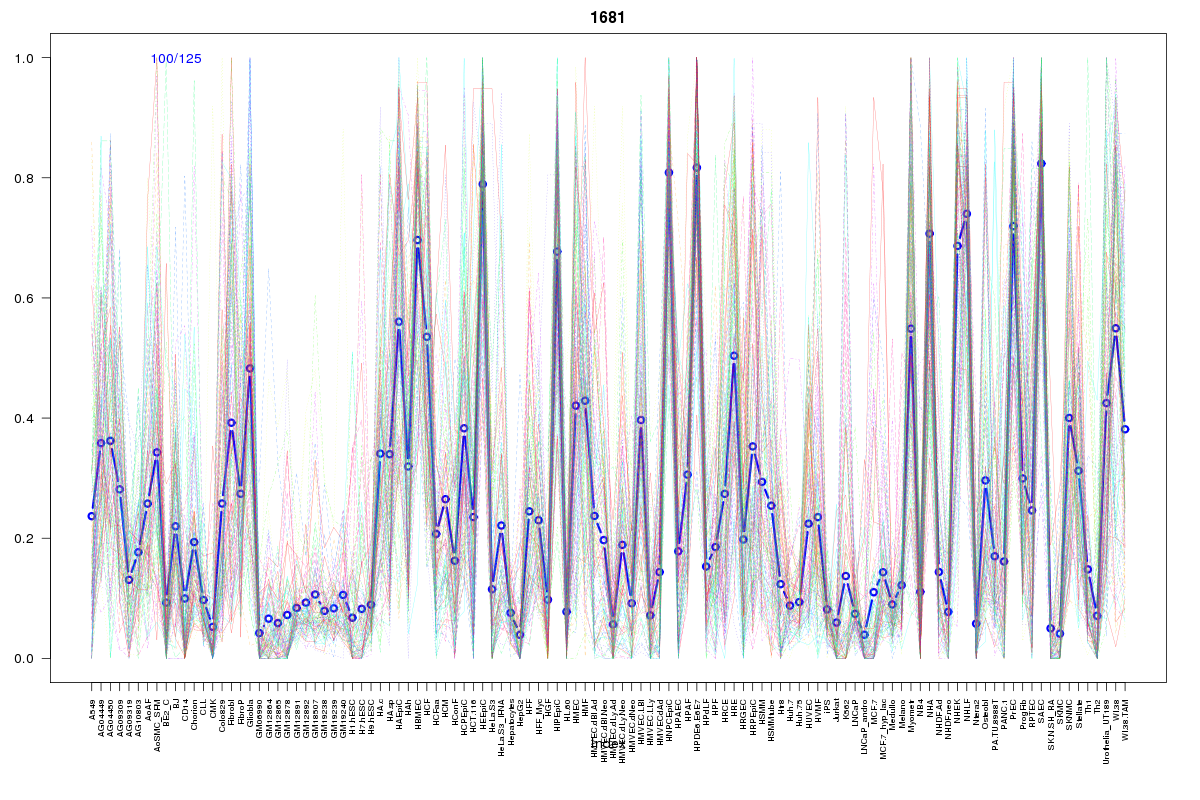
Cluster Hypersensitivity Profile

Genomic Location Trend
These plots show the distribution of the DHS sites surrounding the Transcript Start Site of the nearest gene.
Stats
Number of sites: 125Promoter: 1%
CpG-Island: 0%
Conserved: 31%
Enriched Motifs & Matches
Match Detail: [Jaspar]
|
| ||
|---|---|---|
| Sites: 55/100 | e-val: 4.7e-39 | ||
| Factor | e-val(match) | DB |
| AP1 | 0.000000000066816 | JASPAR |
| NFE2L2 | 0.0000000072886 | JASPAR |
| PPARG | 0.0028058 | JASPAR |
| NFE2L1::MafG | 0.0043619 | JASPAR |
| PBX1 | 0.011365 | JASPAR |
BED file downloads
Top 10 Example Regions
| Location | Gene Link | Dist. |
|---|---|---|
| chr10: 1032440-1032590 | AL359878.1 | 53.97 |
| chr10: 1032440-1032590 | WDR37 | 53.97 |
| chr6: 105766680-105766830 | PREP | 59.86 |
| chr12: 95388200-95388350 | FGD6 | 61.25 |
| chr18: 8122200-8122350 | PTPRM | 67.16 |
| chr20: 36623060-36623210 | VSTM2L | 69.3 |
| chr1: 214595740-214595890 | RP11-176D17.3 | 73.62 |
| chr1: 214595740-214595890 | PTPN14 | 73.62 |
| chr3: 156839885-156840035 | RP11-6F2.5 | 76.13 |
| chr3: 156839885-156840035 | LINC00881 | 76.13 |