SOM cluster: 1750
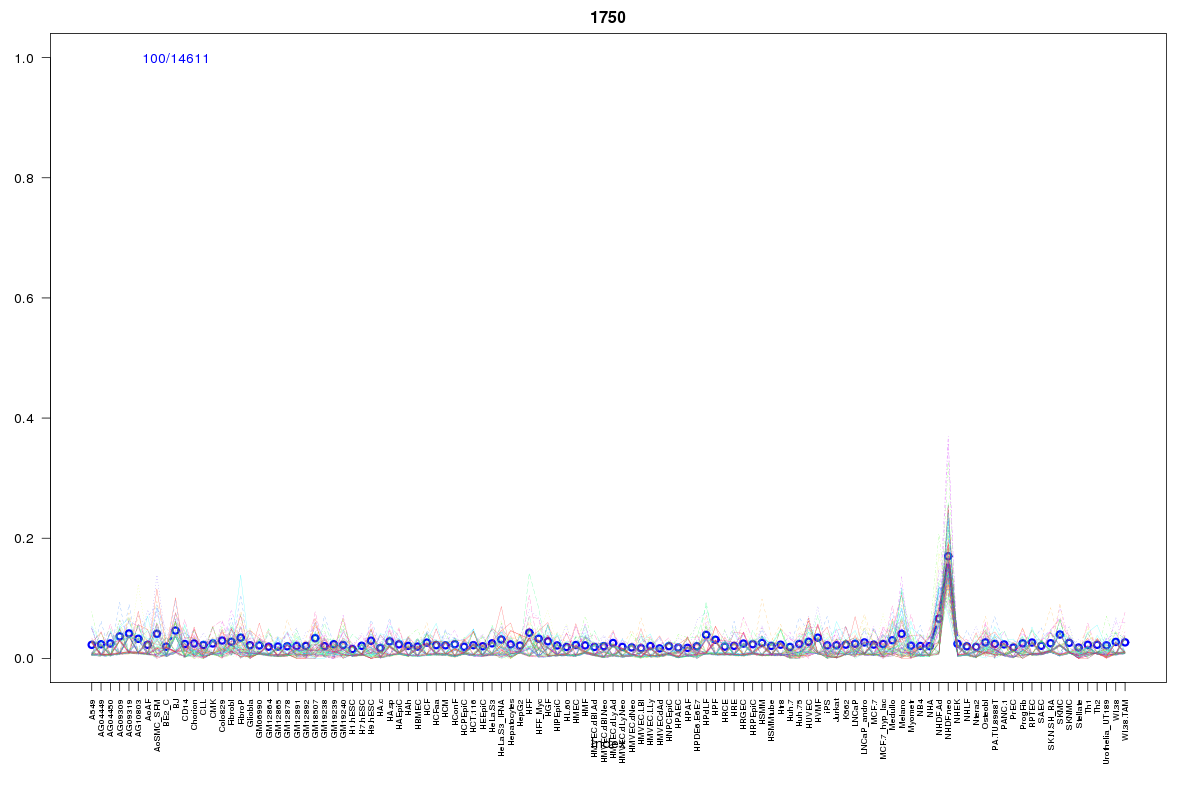
Cluster Hypersensitivity Profile

Genomic Location Trend
These plots show the distribution of the DHS sites surrounding the Transcript Start Site of the nearest gene.
Stats
Number of sites: 14611Promoter: 0%
CpG-Island: 0%
Conserved: 12%
Enriched Motifs & Matches
Match Detail: [Jaspar]
|
| ||
|---|---|---|
| Sites: 30/100 | e-val: 0.000096 | ||
| Factor | e-val(match) | DB |
| Foxd3 | 0.000053474 | JASPAR |
| HNF1B | 0.000078854 | JASPAR |
| Lhx3 | 0.000082567 | JASPAR |
| MEF2A | 0.00020727 | JASPAR |
| Foxq1 | 0.0010818 | JASPAR |
BED file downloads
Top 10 Example Regions
| Location | Gene Link | Dist. |
|---|---|---|
| chr7: 82247420-82247570 | AC004006.2 | 21.94 |
| chr11: 60727625-60727775 | CD6 | 32.08 |
| chr11: 60727625-60727775 | ZP1 | 32.08 |
| chr8: 10262860-10263010 | PRSS51 | 36.14 |
| chr4: 100313160-100313310 | RP11-696N14.1 | 37.87 |
| chr5: 78733200-78733350 | RP11-342F17.2 | 40.35 |
| chr9: 107281380-107281530 | OR13C5 | 41 |
| chr1: 171744640-171744790 | VAMP4 | 41.88 |
| chr1: 171744640-171744790 | DNM3 | 41.88 |
| chr9: 133697920-133698070 | ABL1 | 42.39 |