SOM cluster: 1758
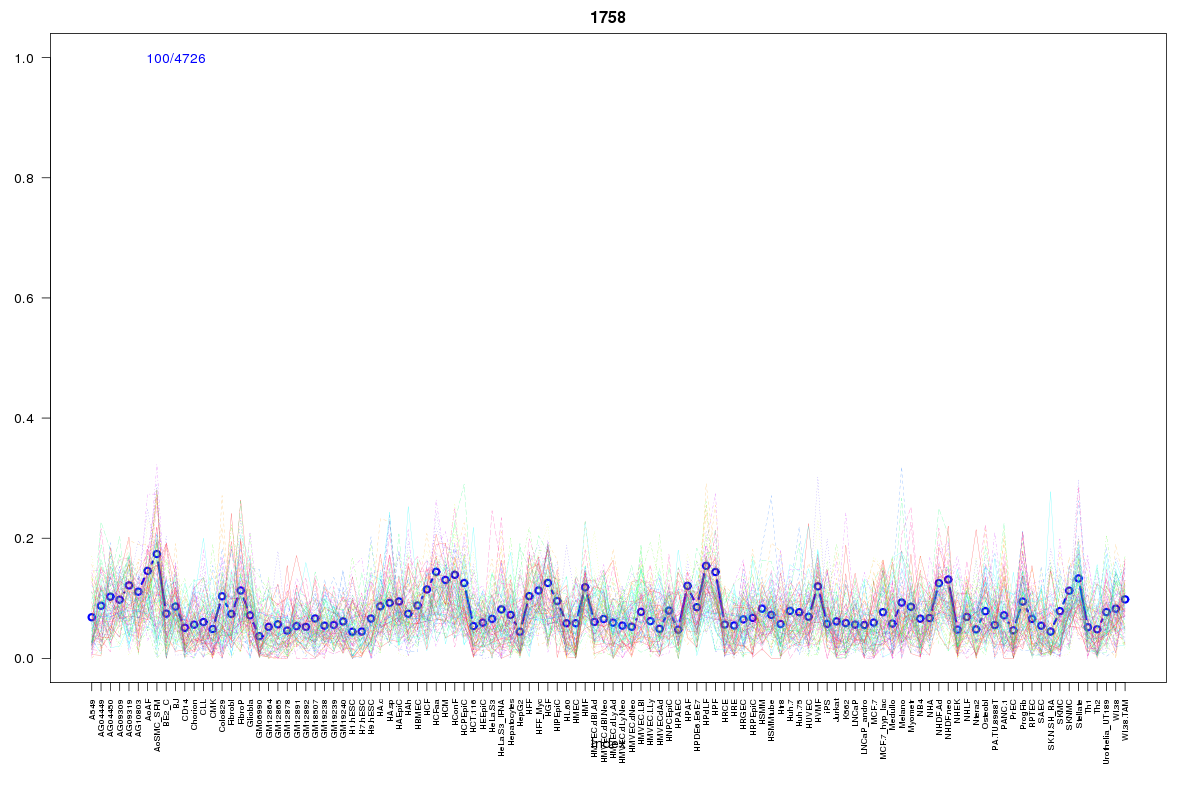
Cluster Hypersensitivity Profile

Genomic Location Trend
These plots show the distribution of the DHS sites surrounding the Transcript Start Site of the nearest gene.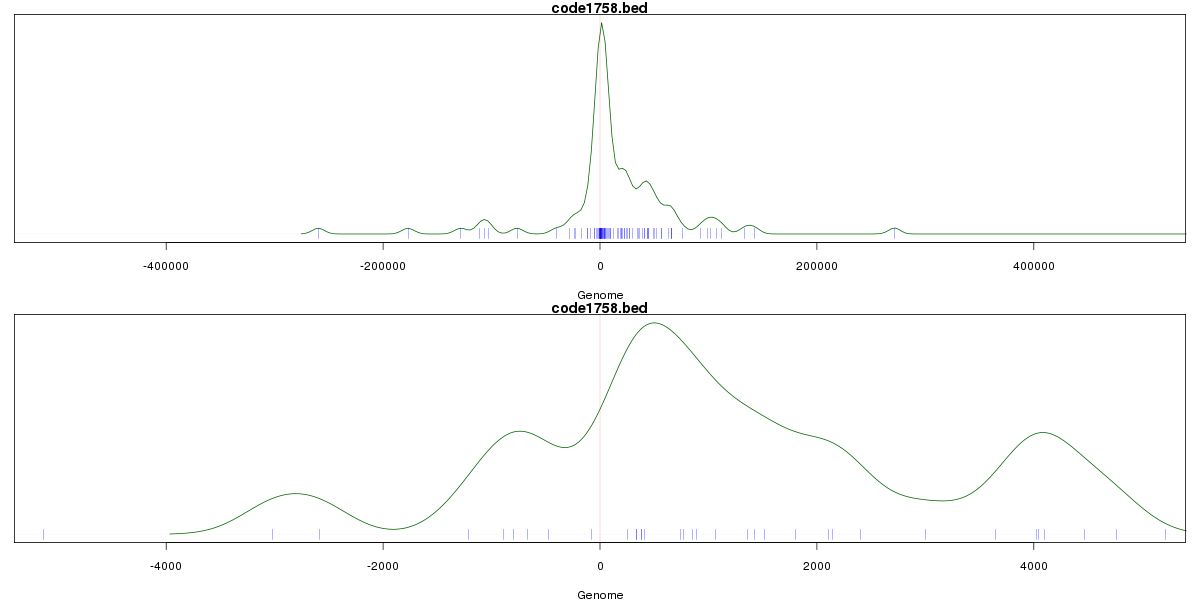
Stats
Number of sites: 4726Promoter: 8%
CpG-Island: 4%
Conserved: 20%
Enriched Motifs & Matches
Match Detail: [Jaspar]
|
| ||
|---|---|---|
| Sites: 19/100 | e-val: 1.8 | ||
| Factor | e-val(match) | DB |
| Foxd3 | 0.00000018308 | JASPAR |
| Foxq1 | 0.000013741 | JASPAR |
| Pax4 | 0.00002086 | JASPAR |
| FOXI1 | 0.00008859 | JASPAR |
| FOXA1 | 0.00014287 | JASPAR |
BED file downloads
Top 10 Example Regions
| Location | Gene Link | Dist. |
|---|---|---|
| chr1: 146715760-146715910 | RP11-337C18.4 | 13.02 |
| chr1: 147807580-147807730 | RP11-495P10.8 | 13.02 |
| chr1: 150544640-150544790 | MCL1 | 25.05 |
| chr1: 150544640-150544790 | LINC00568 | 25.05 |
| chr1: 150780300-150780450 | HORMAD1 | 28.76 |
| chr18: 42261485-42261635 | SETBP1 | 30.58 |
| chr8: 20192960-20193110 | LZTS1-AS1 | 31.06 |
| chr8: 20192960-20193110 | LZTS1 | 31.06 |
| chr8: 20192960-20193110 | RP11-563N12.2 | 31.06 |
| chr12: 6650185-6650335 | GAPDH | 38.04 |