SOM cluster: 1765
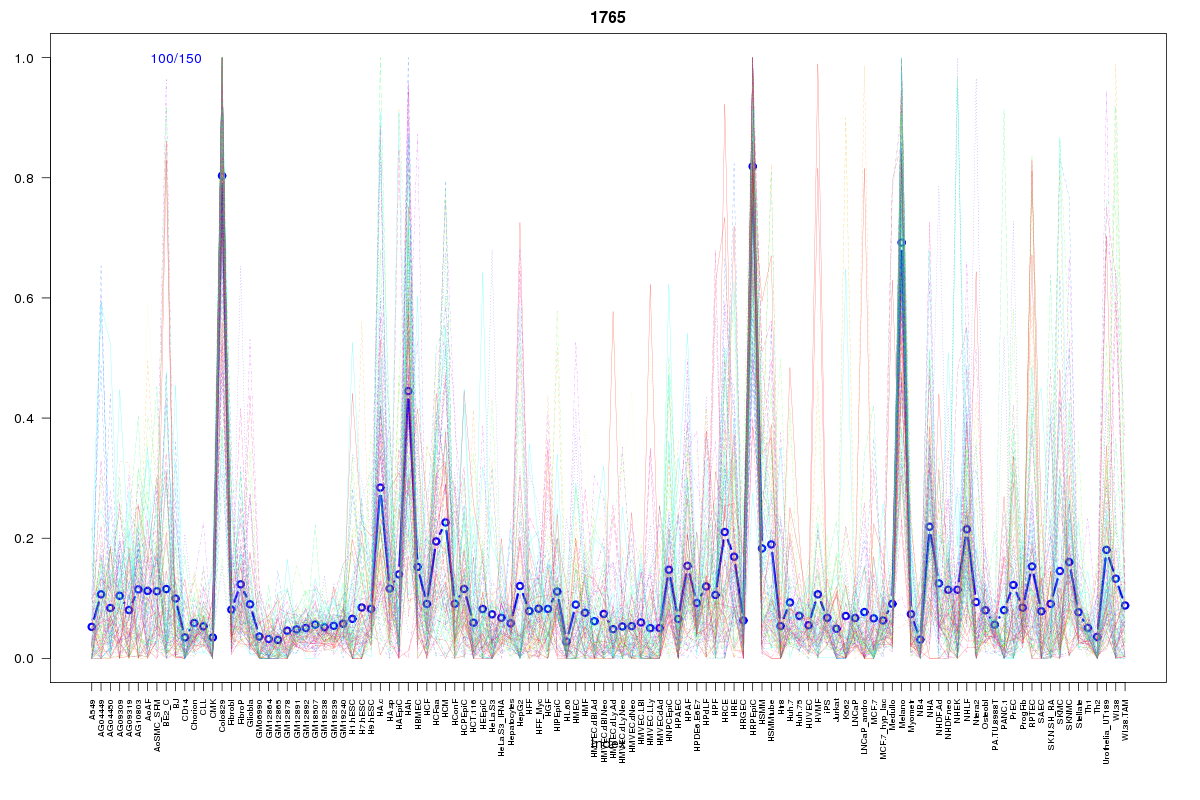
Cluster Hypersensitivity Profile

Genomic Location Trend
These plots show the distribution of the DHS sites surrounding the Transcript Start Site of the nearest gene.
Stats
Number of sites: 150Promoter: 4%
CpG-Island: 0%
Conserved: 67%
Enriched Motifs & Matches
Match Detail: [Jaspar]
|
| ||
|---|---|---|
| Sites: 49/100 | e-val: 1.5e-36 | ||
| Factor | e-val(match) | DB |
| SOX10 | 0.0000024923 | JASPAR |
| SOX9 | 0.000044354 | JASPAR |
| Sox2 | 0.0028816 | JASPAR |
| Sox5 | 0.014462 | JASPAR |
| SRY | 0.018491 | JASPAR |
BED file downloads
Top 10 Example Regions
| Location | Gene Link | Dist. |
|---|---|---|
| chr8: 79692600-79692750 | ZC2HC1A | 41.83 |
| chr4: 170877740-170877890 | MFAP3L | 54.03 |
| chr4: 170877740-170877890 | RP11-205M3.3 | 54.03 |
| chr10: 97211745-97211895 | SORBS1 | 56.82 |
| chr11: 126264680-126264830 | ST3GAL4 | 57.58 |
| chr11: 112148720-112148870 | PTS | 66.49 |
| chr22: 28567240-28567390 | TTC28 | 74.35 |
| chr5: 112539240-112539390 | MCC | 82.75 |
| chr3: 118706460-118706610 | IGSF11 | 83.7 |
| chr3: 118706460-118706610 | IGSF11-AS1 | 83.7 |