SOM cluster: 1777
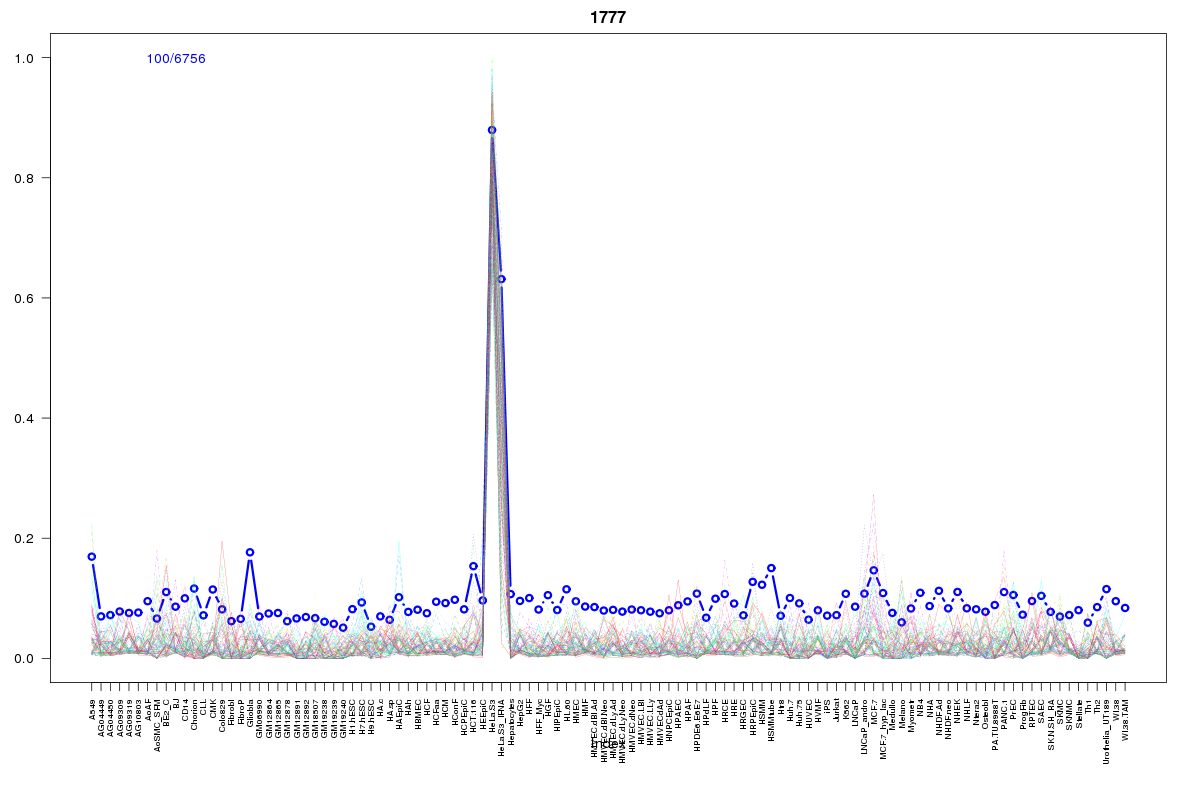
Cluster Hypersensitivity Profile

Genomic Location Trend
These plots show the distribution of the DHS sites surrounding the Transcript Start Site of the nearest gene.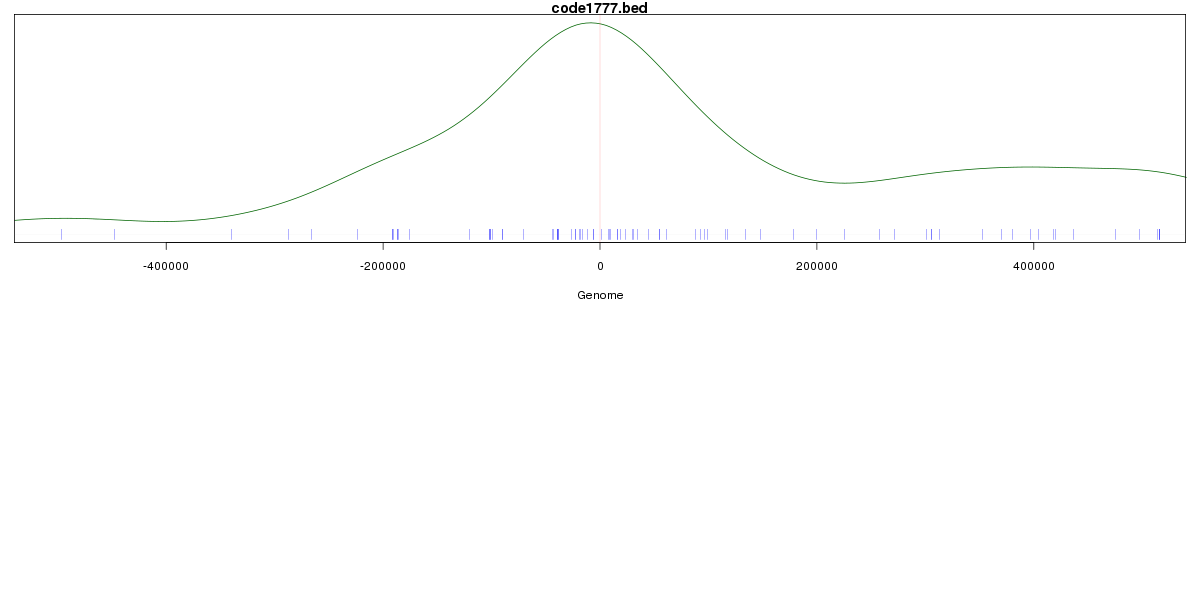
Stats
Number of sites: 6756Promoter: 0%
CpG-Island: 0%
Conserved: 27%
Enriched Motifs & Matches
Match Detail: [Jaspar]
|
| ||
|---|---|---|
| Sites: 43/100 | e-val: 0.00000000000012 | ||
| Factor | e-val(match) | DB |
| HNF1A | 0.00096151 | JASPAR |
| HNF1B | 0.0010618 | JASPAR |
| MEF2A | 0.0019256 | JASPAR |
| Foxq1 | 0.002526 | JASPAR |
| Prrx2 | 0.012204 | JASPAR |
BED file downloads
Top 10 Example Regions
| Location | Gene Link | Dist. |
|---|---|---|
| chr1: 92311480-92311630 | TGFBR3 | 13.64 |
| chr2: 75847465-75847615 | MRPL19 | 25.23 |
| chr8: 10571400-10571550 | SOX7 | 26.95 |
| chr12: 9949800-9949950 | CLEC2B | 36.34 |
| chr9: 130486225-130486375 | CDK9 | 36.54 |
| chr9: 130486225-130486375 | RP11-228B15.4 | 36.54 |
| chr12: 93293805-93293955 | EEA1 | 39.46 |
| chr12: 33059440-33059590 | RP11-267D19.2 | 39.72 |
| chr12: 120620020-120620170 | RPS20P31 | 41.72 |
| chr2: 136707380-136707530 | AC011999.1 | 42.14 |