SOM cluster: 1796
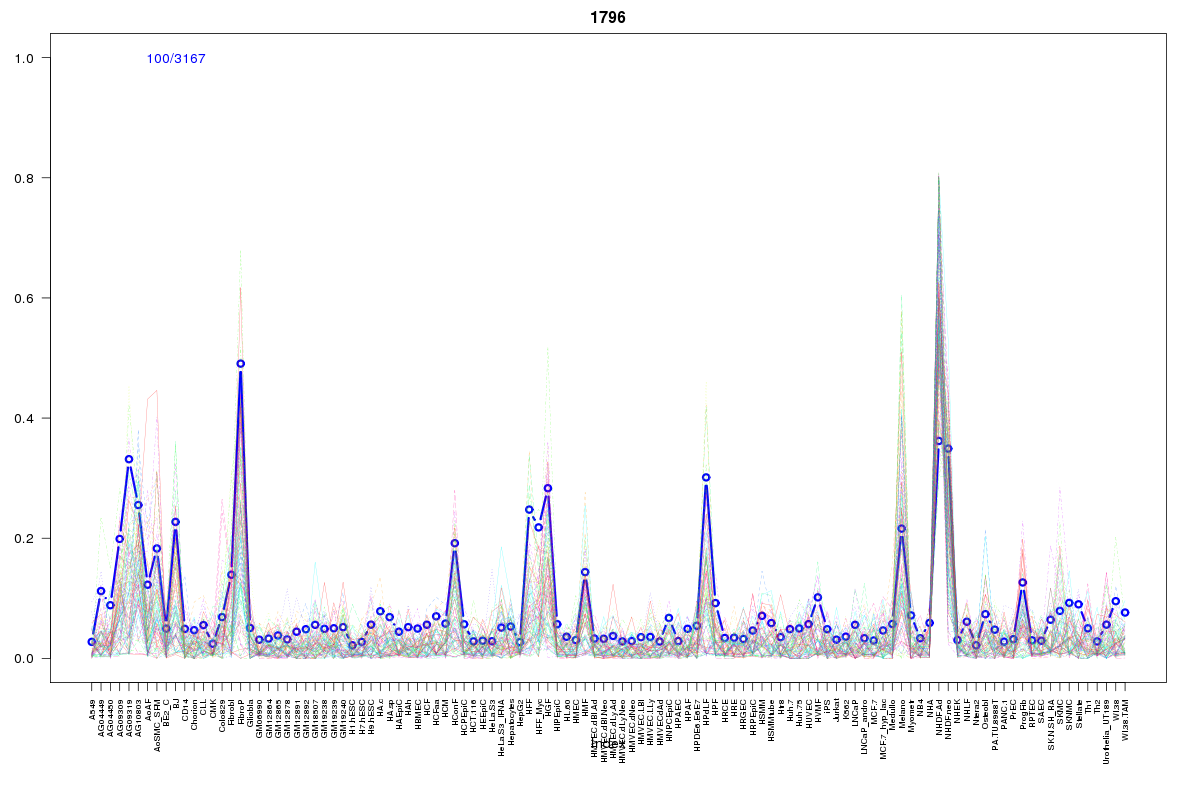
Cluster Hypersensitivity Profile

Genomic Location Trend
These plots show the distribution of the DHS sites surrounding the Transcript Start Site of the nearest gene.
Stats
Number of sites: 3167Promoter: 0%
CpG-Island: 0%
Conserved: 45%
Enriched Motifs & Matches
Match Detail: [Jaspar]
|
| ||
|---|---|---|
| Sites: 47/100 | e-val: 3.2e-23 | ||
| Factor | e-val(match) | DB |
| Lhx3 | 0.00000036332 | JASPAR |
| ARID3A | 0.0000076913 | JASPAR |
| HNF1A | 0.000046134 | JASPAR |
| TAL1::TCF3 | 0.000062139 | JASPAR |
| Prrx2 | 0.000095455 | JASPAR |
|
| ||
| Sites: 20/100 | e-val: 0.028 | ||
| Factor | e-val(match) | DB |
| Foxd3 | 0.000035049 | JASPAR |
| MEF2A | 0.000055212 | JASPAR |
| Foxq1 | 0.0044402 | JASPAR |
| CEBPA | 0.0046835 | JASPAR |
| FOXI1 | 0.0048635 | JASPAR |
BED file downloads
Top 10 Example Regions
| Location | Gene Link | Dist. |
|---|---|---|
| chr1: 91942780-91942930 | RP11-47K11.2 | 27.18 |
| chr5: 115195220-115195370 | ATG12 | 38.85 |
| chr5: 115195220-115195370 | AP3S1 | 38.85 |
| chr8: 123832200-123832350 | AC016405.1 | 40 |
| chr8: 98305305-98305455 | TSPYL5 | 41.91 |
| chr8: 98305305-98305455 | U3 | 41.91 |
| chr1: 92219520-92219670 | TGFBR3 | 42.17 |
| chr10: 7604140-7604290 | ITIH5 | 42.59 |
| chr17: 66636860-66637010 | FAM20A | 43.51 |
| chr8: 102156160-102156310 | KB-1460A1.1 | 44.7 |