SOM cluster: 1821
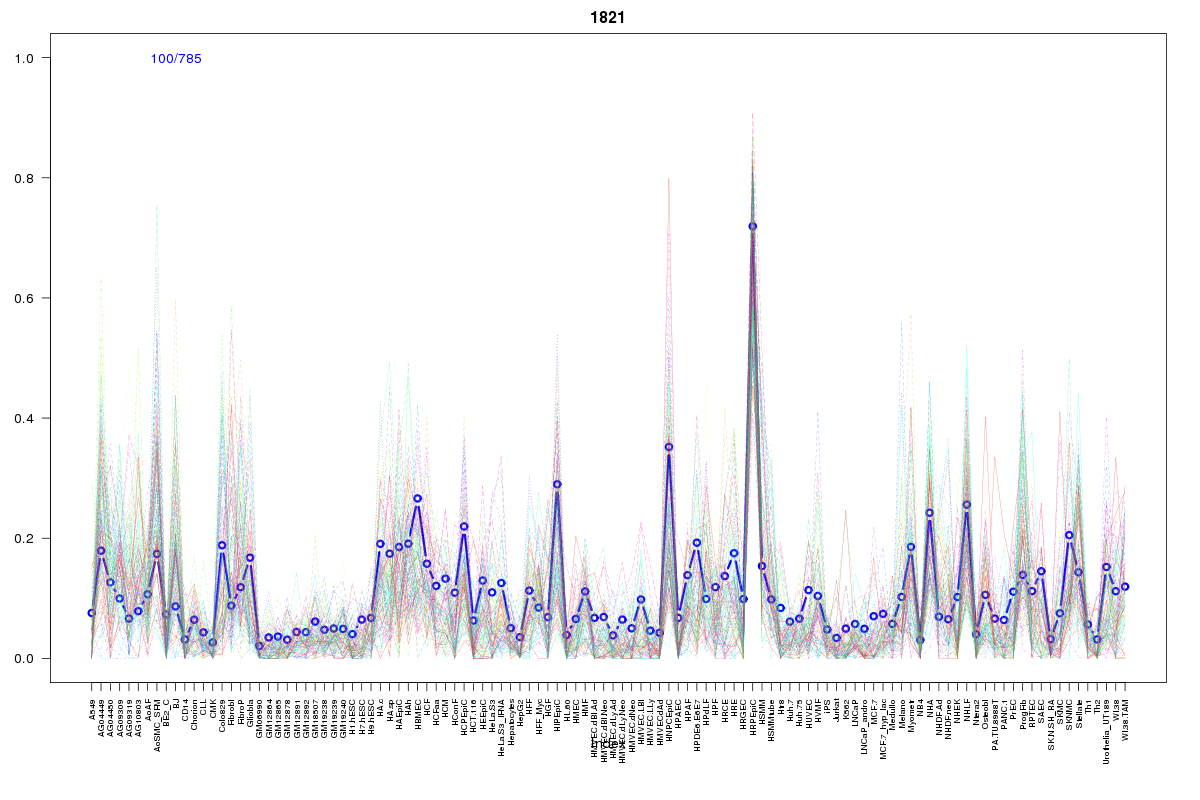
Cluster Hypersensitivity Profile

Genomic Location Trend
These plots show the distribution of the DHS sites surrounding the Transcript Start Site of the nearest gene.
Stats
Number of sites: 785Promoter: 0%
CpG-Island: 0%
Conserved: 36%
Enriched Motifs & Matches
Match Detail: [Jaspar]
|
| ||
|---|---|---|
| Sites: 36/100 | e-val: 0.95 | ||
| Factor | e-val(match) | DB |
| Foxd3 | 0.0032046 | JASPAR |
| MEF2A | 0.010193 | JASPAR |
| Foxa2 | 0.012288 | JASPAR |
| Prrx2 | 0.012687 | JASPAR |
| Evi1 | 0.014724 | JASPAR |
BED file downloads
Top 10 Example Regions
| Location | Gene Link | Dist. |
|---|---|---|
| chr1: 95045920-95046070 | F3 | 31.82 |
| chr1: 95045920-95046070 | RP11-86H7.7 | 31.82 |
| chr8: 120615080-120615230 | ENPP2 | 41.98 |
| chr18: 56342180-56342330 | ALPK2 | 47.28 |
| chr8: 124626960-124627110 | ANXA13 | 49.28 |
| chr8: 124626960-124627110 | FBXO32 | 49.28 |
| chr7: 43522100-43522250 | HECW1 | 49.83 |
| chr21: 35349540-35349690 | SLC5A3 | 50.48 |
| chr21: 35349540-35349690 | MRPS6 | 50.48 |
| chr3: 189893460-189893610 | LEPREL1 | 50.97 |