SOM cluster: 1831
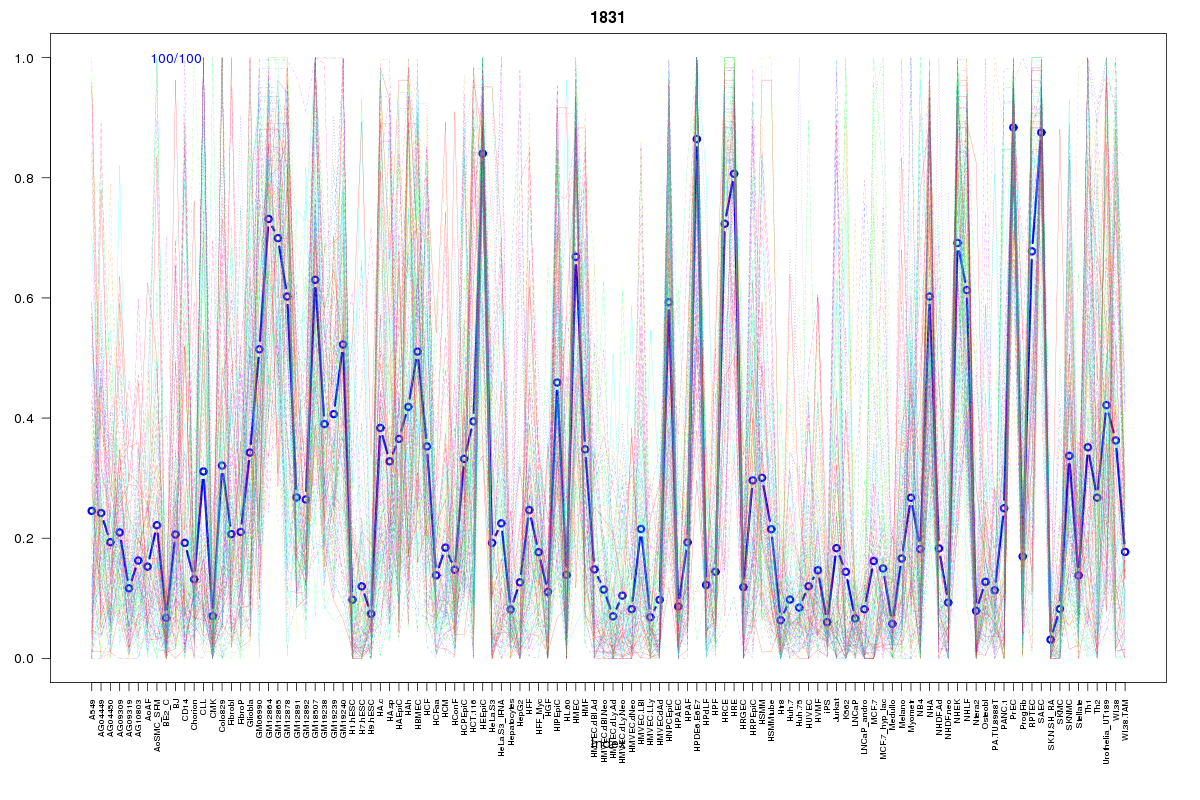
Cluster Hypersensitivity Profile

Genomic Location Trend
These plots show the distribution of the DHS sites surrounding the Transcript Start Site of the nearest gene.
Stats
Number of sites: 100Promoter: 2%
CpG-Island: 0%
Conserved: 40%
Enriched Motifs & Matches
Match Detail: [Jaspar]
|
| ||
|---|---|---|
| Sites: 70/100 | e-val: 4.5e-39 | ||
| Factor | e-val(match) | DB |
| AP1 | 0.000000018168 | JASPAR |
| NFE2L2 | 0.0000096146 | JASPAR |
| NFE2L1::MafG | 0.011311 | JASPAR |
| Gata1 | 0.067768 | JASPAR |
| Evi1 | 0.097811 | JASPAR |
BED file downloads
Top 10 Example Regions
| Location | Gene Link | Dist. |
|---|---|---|
| chrX: 9797720-9797870 | Y_RNA | 41.92 |
| chr10: 85939345-85939495 | C10orf99 | 47.02 |
| chr10: 85939345-85939495 | CDHR1 | 47.02 |
| chr10: 1082280-1082430 | GTPBP4 | 56.31 |
| chr10: 1082280-1082430 | IDI2 | 56.31 |
| chr10: 1082280-1082430 | WDR37 | 56.31 |
| chr10: 1082280-1082430 | IDI1 | 56.31 |
| chr3: 141056065-141056215 | ZBTB38 | 61.34 |
| chr6: 16685520-16685670 | ATXN1 | 65.21 |
| chr6: 16685520-16685670 | RP1-151F17.1 | 65.21 |