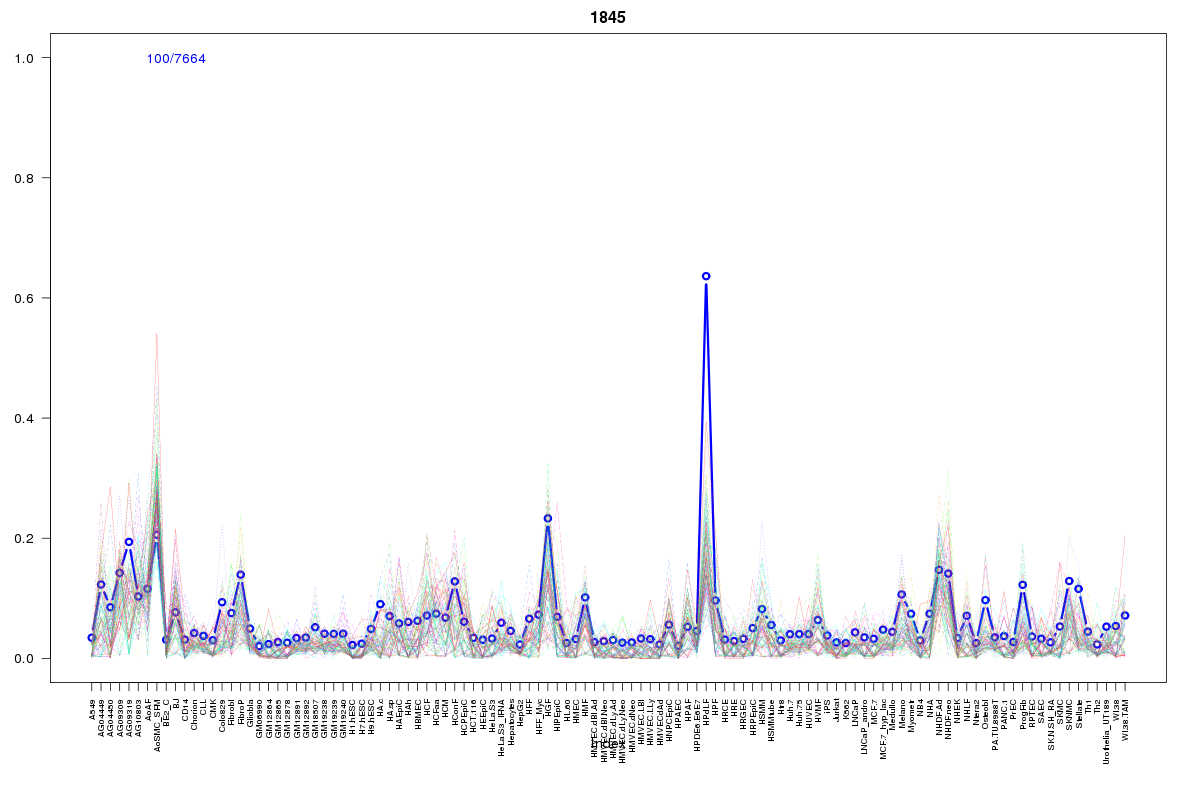
SOM cluster: 1845
Cluster Hypersensitivity Profile

Genomic Location Trend
These plots show the distribution of the DHS sites surrounding the Transcript Start Site of the nearest gene.
Stats
Number of sites: 7664Promoter: 1%
CpG-Island: 0%
Conserved: 30%
Enriched Motifs & Matches
Match Detail: [Jaspar]
|
| ||
|---|---|---|
| Sites: 55/100 | e-val: 0.0000000000000067 | ||
| Factor | e-val(match) | DB |
| Foxq1 | 0.00029223 | JASPAR |
| Pax4 | 0.0003501 | JASPAR |
| Prrx2 | 0.0010044 | JASPAR |
| HNF1A | 0.0028974 | JASPAR |
| HNF1B | 0.0061051 | JASPAR |
BED file downloads
Top 10 Example Regions
| Location | Gene Link | Dist. |
|---|---|---|
| chr1: 92048605-92048755 | TGFBR3 | 9.54 |
| chr1: 196431360-196431510 | KCNT2 | 22.92 |
| chr6: 119594785-119594935 | MAN1A1 | 27.41 |
| chr1: 53606080-53606230 | RP11-334A14.5 | 31.12 |
| chr1: 53606080-53606230 | RP11-334A14.8 | 31.12 |
| chr1: 53606080-53606230 | SLC1A7 | 31.12 |
| chr1: 53606080-53606230 | PODN | 31.12 |
| chr1: 145512440-145512590 | HFE2 | 33.49 |
| chr1: 145512440-145512590 | TXNIP | 33.49 |
| chr12: 12813420-12813570 | CREBL2 | 34.91 |