SOM cluster: 1857
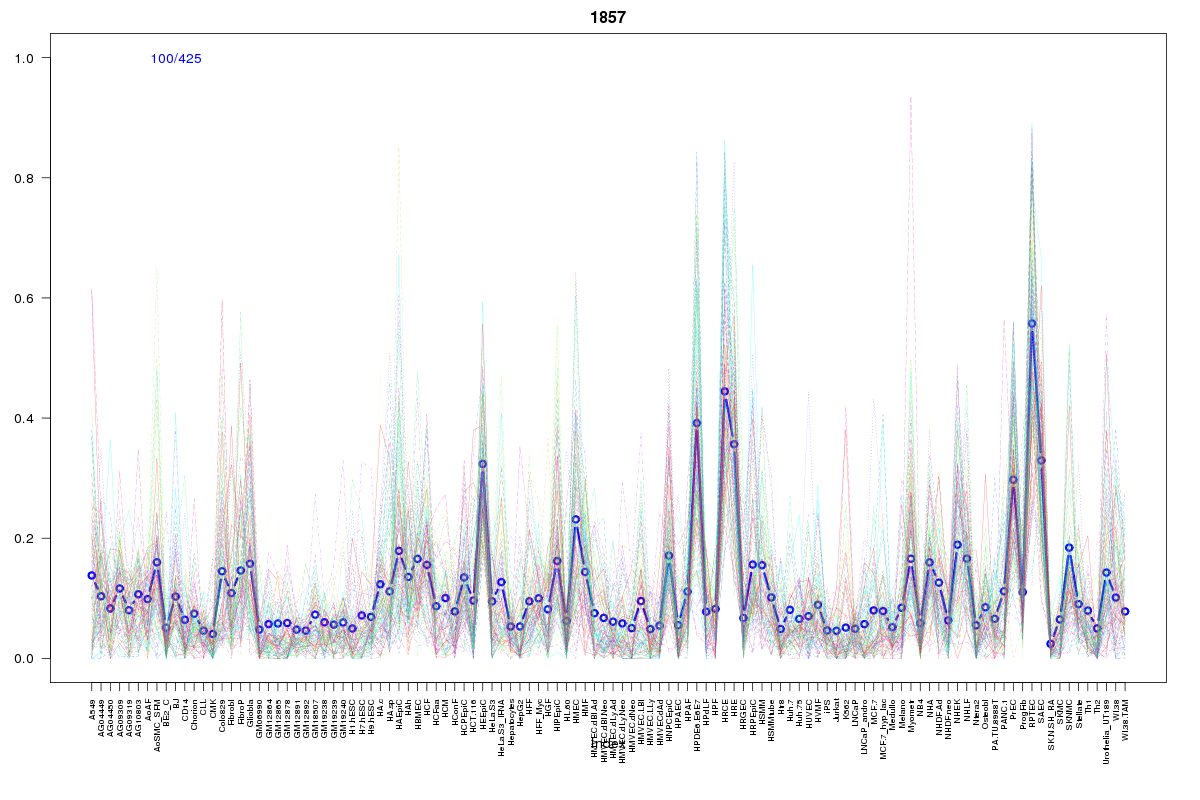
Cluster Hypersensitivity Profile

Genomic Location Trend
These plots show the distribution of the DHS sites surrounding the Transcript Start Site of the nearest gene.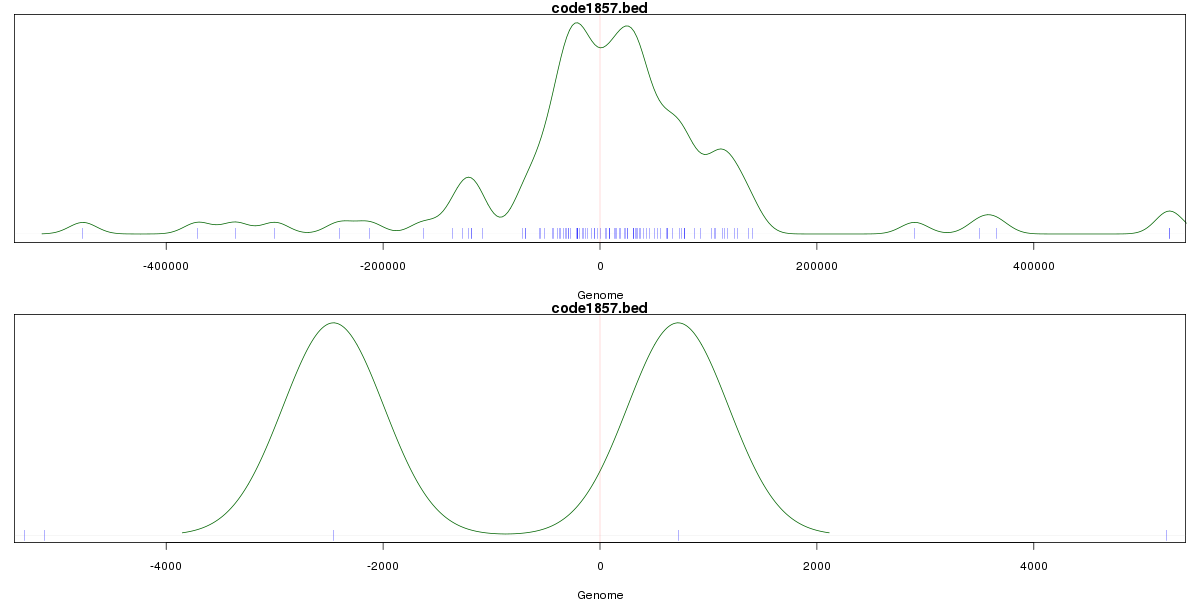
Stats
Number of sites: 425Promoter: 0%
CpG-Island: 0%
Conserved: 21%
Enriched Motifs & Matches
Match Detail: [Jaspar]
|
| ||
|---|---|---|
| Sites: 44/100 | e-val: 0.000000000025 | ||
| Factor | e-val(match) | DB |
| AP1 | 0.00000000043764 | JASPAR |
| NFE2L2 | 0.0000000053065 | JASPAR |
| NFE2L1::MafG | 0.00014698 | JASPAR |
| PBX1 | 0.00286 | JASPAR |
| PPARG | 0.0074504 | JASPAR |
BED file downloads
Top 10 Example Regions
| Location | Gene Link | Dist. |
|---|---|---|
| chr4: 1323440-1323590 | NKX1-1 | 48.21 |
| chr4: 1323440-1323590 | MAEA | 48.21 |
| chr2: 28904540-28904690 | PPP1CB | 52.39 |
| chr18: 39627820-39627970 | PIK3C3 | 53.3 |
| chr1: 162262240-162262390 | NOS1AP | 57.76 |
| chr1: 162262240-162262390 | C1orf226 | 57.76 |
| chr13: 77429120-77429270 | BTF3P11 | 59.19 |
| chr10: 84048500-84048650 | NRG3-AS1 | 61.2 |
| chr7: 94994600-94994750 | PON2 | 61.66 |
| chr7: 94994600-94994750 | AC004022.8 | 61.66 |