SOM cluster: 1881
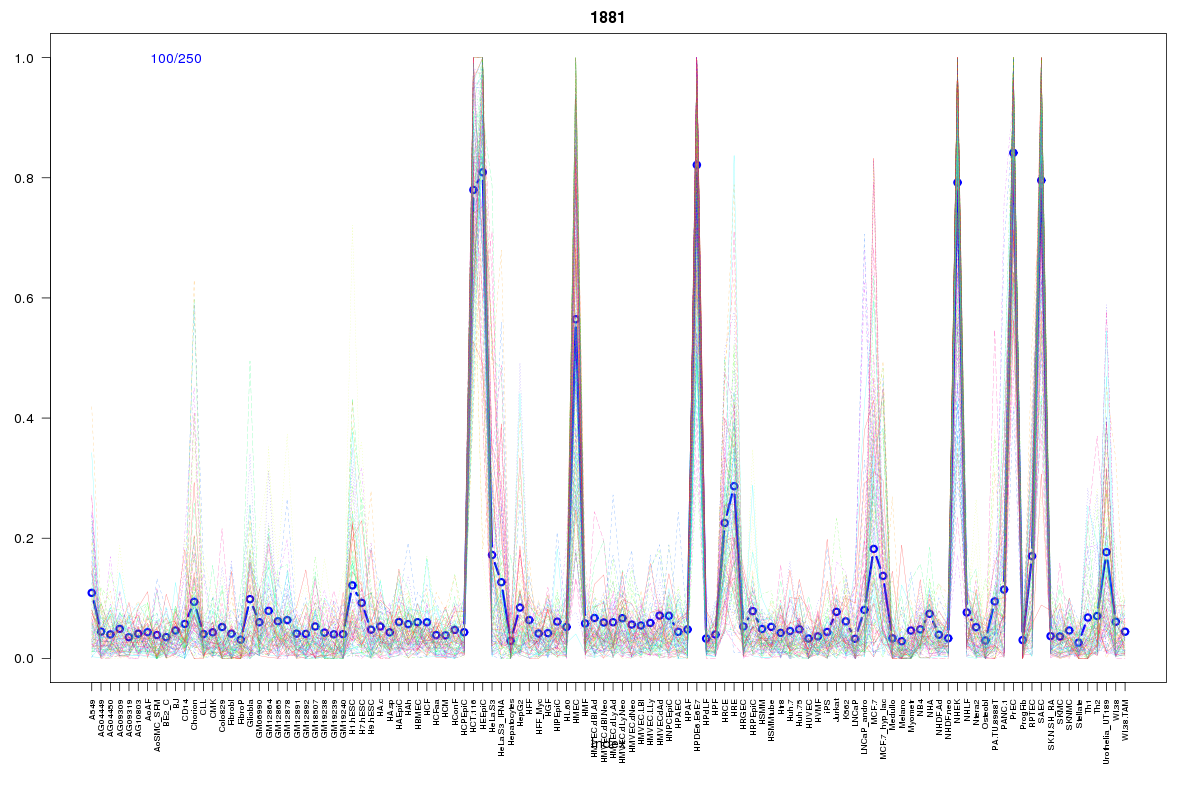
Cluster Hypersensitivity Profile

Genomic Location Trend
These plots show the distribution of the DHS sites surrounding the Transcript Start Site of the nearest gene.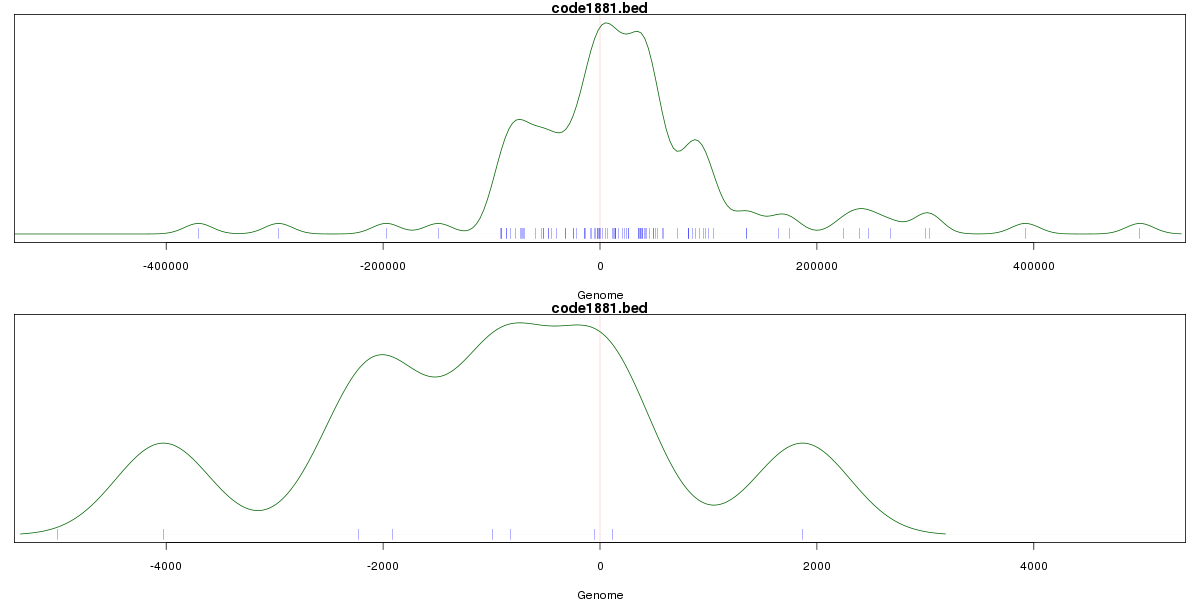
Stats
Number of sites: 250Promoter: 4%
CpG-Island: 0%
Conserved: 37%
Enriched Motifs & Matches
Match Detail: [Jaspar]
|
| ||
|---|---|---|
| Sites: 47/100 | e-val: 1.2e-25 | ||
| Factor | e-val(match) | DB |
| AP1 | 0.0000000015707 | JASPAR |
| NFE2L2 | 0.000000018865 | JASPAR |
| NFE2L1::MafG | 0.0022068 | JASPAR |
| PPARG | 0.0073541 | JASPAR |
| PBX1 | 0.0263 | JASPAR |
BED file downloads
Top 10 Example Regions
| Location | Gene Link | Dist. |
|---|---|---|
| chr1: 209577420-209577570 | MIR205HG | 46.27 |
| chr6: 29758540-29758690 | HLA-G | 46.59 |
| chr6: 29758540-29758690 | HLA-F-AS1 | 46.59 |
| chr6: 29758540-29758690 | HCG4 | 46.59 |
| chr6: 29758540-29758690 | HLA-V | 46.59 |
| chr10: 120951560-120951710 | GRK5-IT1 | 47 |
| chr18: 61139780-61139930 | ATP5G1P6 | 49.97 |
| chr18: 61139780-61139930 | VPS4B | 49.97 |
| chr18: 61139780-61139930 | SERPINB5 | 49.97 |
| chr15: 101417860-101418010 | ALDH1A3 | 50.68 |