SOM cluster: 1911
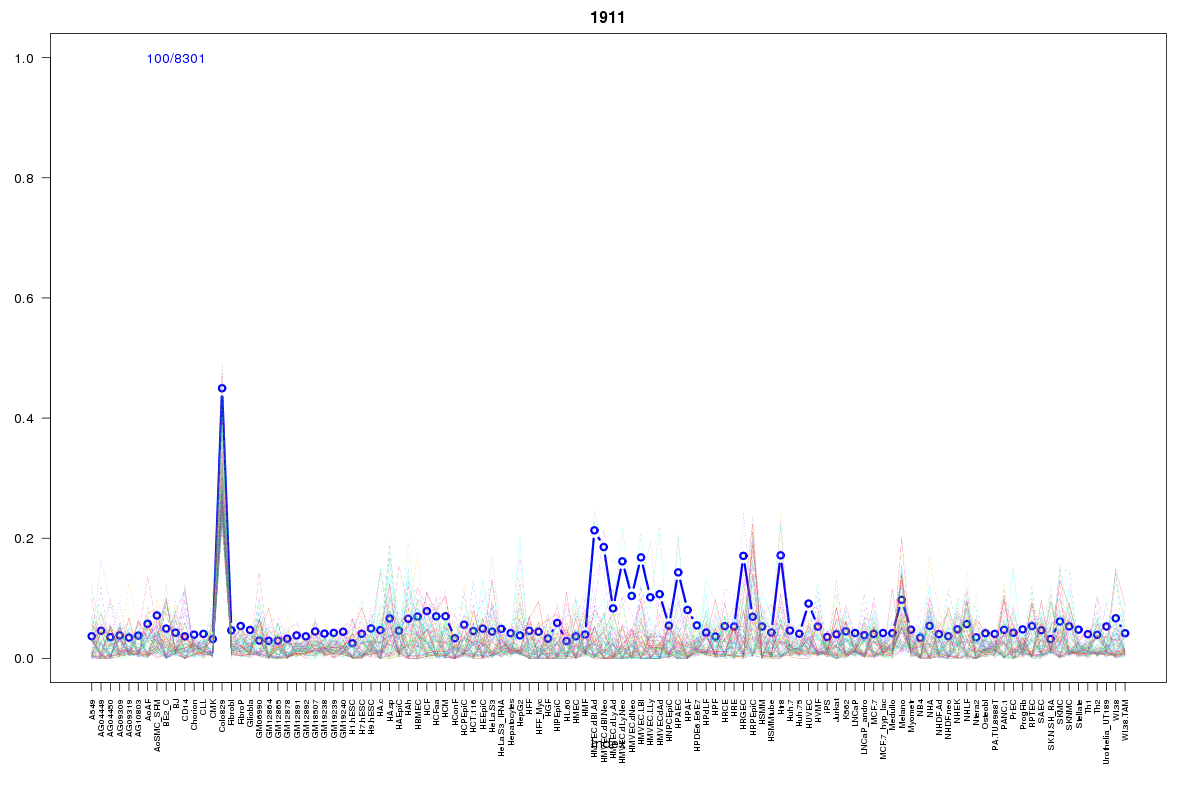
Cluster Hypersensitivity Profile

Genomic Location Trend
These plots show the distribution of the DHS sites surrounding the Transcript Start Site of the nearest gene.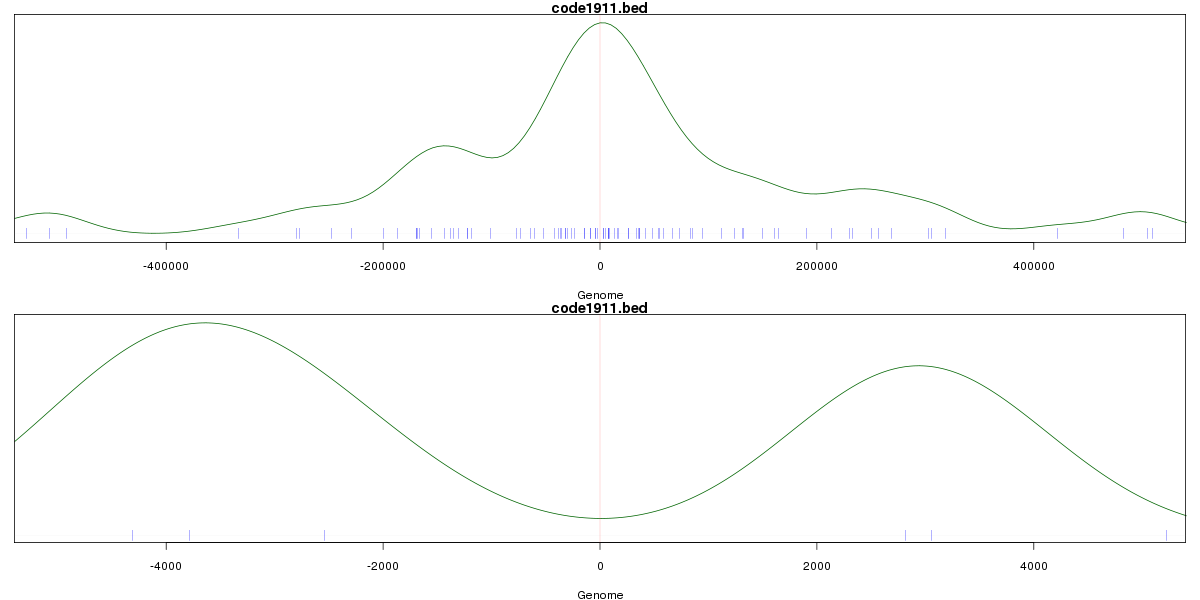
Stats
Number of sites: 8301Promoter: 0%
CpG-Island: 0%
Conserved: 28%
Enriched Motifs & Matches
Match Detail: [Jaspar]
|
| ||
|---|---|---|
| Sites: 55/100 | e-val: 0.0000000000098 | ||
| Factor | e-val(match) | DB |
| SOX10 | 0.00043074 | JASPAR |
| Lhx3 | 0.0010507 | JASPAR |
| Foxd3 | 0.0041733 | JASPAR |
| MEF2A | 0.01115 | JASPAR |
| Pax4 | 0.011361 | JASPAR |
BED file downloads
Top 10 Example Regions
| Location | Gene Link | Dist. |
|---|---|---|
| chr7: 133558660-133558810 | EXOC4 | 29.99 |
| chr3: 129010245-129010395 | H1FX-AS1 | 30.18 |
| chr11: 16317900-16318050 | SOX6 | 32.67 |
| chr8: 37478140-37478290 | ZNF703 | 36.31 |
| chr4: 125348360-125348510 | TECRP2 | 38.17 |
| chr7: 140101920-140102070 | SLC37A3 | 39.57 |
| chr7: 140101920-140102070 | snoU13 | 39.57 |
| chr3: 37291360-37291510 | AC097359.2 | 40.03 |
| chr2: 86528280-86528430 | REEP1 | 41.49 |
| chr1: 160806840-160806990 | ITLN1 | 41.53 |