SOM cluster: 1951
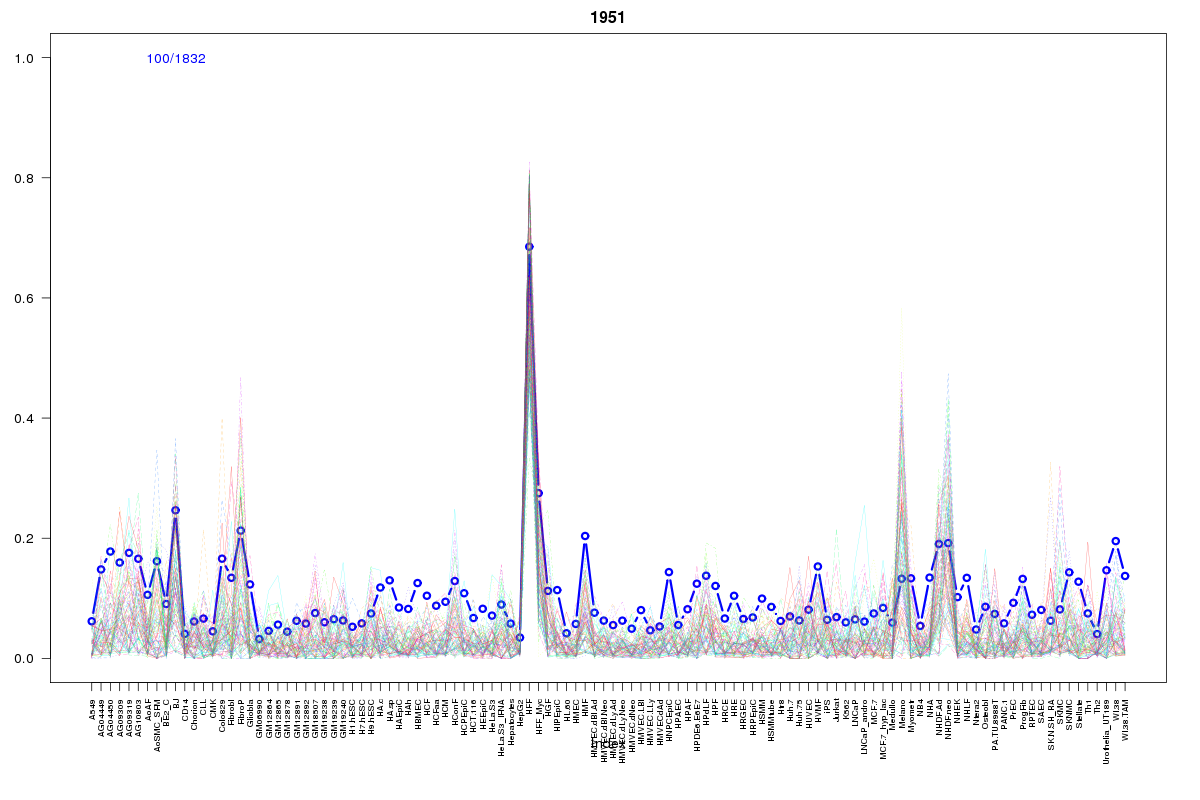
Cluster Hypersensitivity Profile

Genomic Location Trend
These plots show the distribution of the DHS sites surrounding the Transcript Start Site of the nearest gene.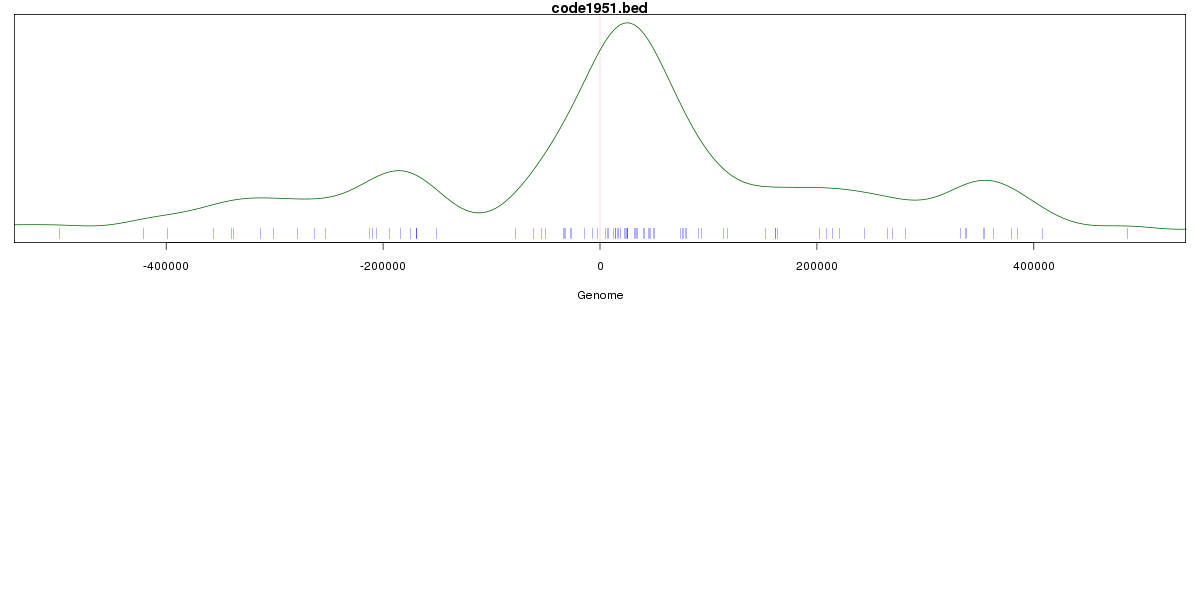
Stats
Number of sites: 1832Promoter: 0%
CpG-Island: 0%
Conserved: 56%
Enriched Motifs & Matches
Match Detail: [Jaspar]
|
| ||
|---|---|---|
| Sites: 44/100 | e-val: 3.3e-29 | ||
| Factor | e-val(match) | DB |
| TAL1::TCF3 | 0.00000028439 | JASPAR |
| HNF1A | 0.00068467 | JASPAR |
| HNF1B | 0.00083748 | JASPAR |
| ELK4 | 0.0038224 | JASPAR |
| FOXO3 | 0.018246 | JASPAR |
BED file downloads
Top 10 Example Regions
| Location | Gene Link | Dist. |
|---|---|---|
| chr1: 92077300-92077450 | RP11-47K11.2 | 3.95 |
| chr3: 29964940-29965090 | RBMS3 | 29.37 |
| chr9: 116942980-116943130 | KIF12 | 37.62 |
| chr3: 37204460-37204610 | LRRFIP2 | 38.23 |
| chr1: 172113620-172113770 | MIR199A2 | 43.65 |
| chr1: 172113620-172113770 | DNM3 | 43.65 |
| chr7: 107734400-107734550 | U3 | 43.89 |
| chr10: 16648560-16648710 | RSU1 | 47.9 |
| chr10: 18744540-18744690 | CACNB2 | 49.09 |
| chr4: 73141220-73141370 | RP11-373J21.1 | 51.12 |