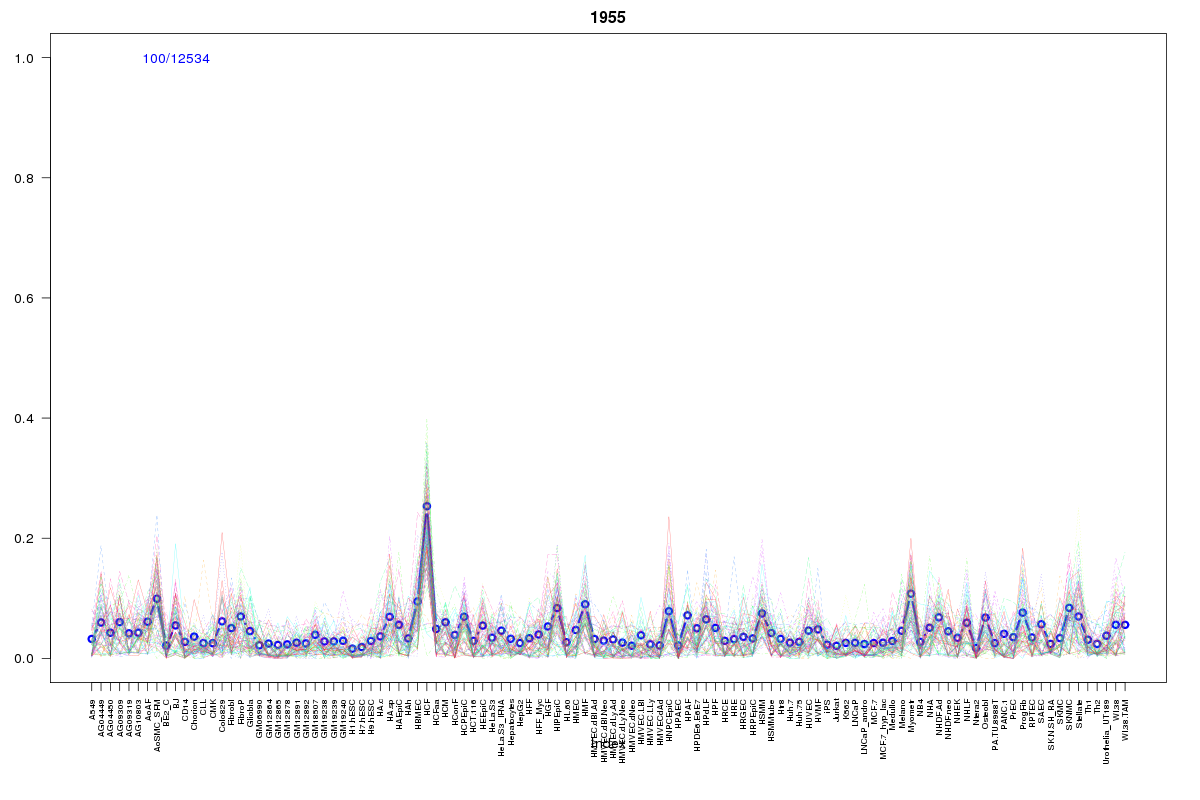
SOM cluster: 1955
Cluster Hypersensitivity Profile

Genomic Location Trend
These plots show the distribution of the DHS sites surrounding the Transcript Start Site of the nearest gene.
Stats
Number of sites: 12534Promoter: 3%
CpG-Island: 0%
Conserved: 17%
Enriched Motifs & Matches
Match Detail: [Jaspar]
|
| ||
|---|---|---|
| Sites: 53/100 | e-val: 9.2e-25 | ||
| Factor | e-val(match) | DB |
| MEF2A | 0.0024237 | JASPAR |
| Lhx3 | 0.0058403 | JASPAR |
| Foxd3 | 0.0080175 | JASPAR |
| SRF | 0.019504 | JASPAR |
| Foxq1 | 0.020739 | JASPAR |
BED file downloads
Top 10 Example Regions
| Location | Gene Link | Dist. |
|---|---|---|
| chr9: 133657765-133657915 | ABL1 | 26.67 |
| chr1: 145563305-145563455 | ANKRD35 | 30.23 |
| chr12: 119622265-119622415 | HSPB8 | 31.08 |
| chr7: 112629720-112629870 | AC018464.3 | 32.92 |
| chr7: 112629720-112629870 | C7orf60 | 32.92 |
| chr6: 39818540-39818690 | DAAM2 | 33.13 |
| chr6: 39818540-39818690 | RP11-61I13.3 | 33.13 |
| chr19: 34783280-34783430 | LSM14A | 38.12 |
| chr8: 37378220-37378370 | RP11-150O12.2 | 38.96 |
| chr6: 1346980-1347130 | FOXF2 | 40.95 |