SOM cluster: 1977
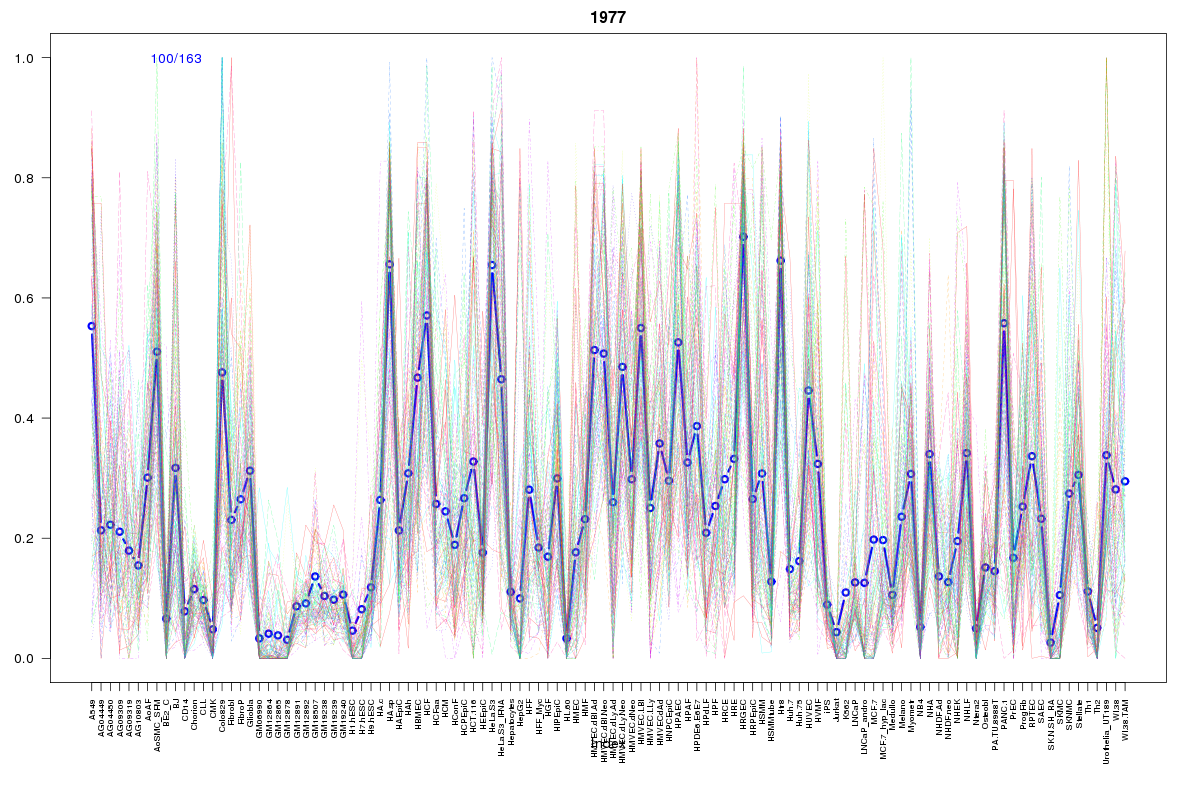
Cluster Hypersensitivity Profile

Genomic Location Trend
These plots show the distribution of the DHS sites surrounding the Transcript Start Site of the nearest gene.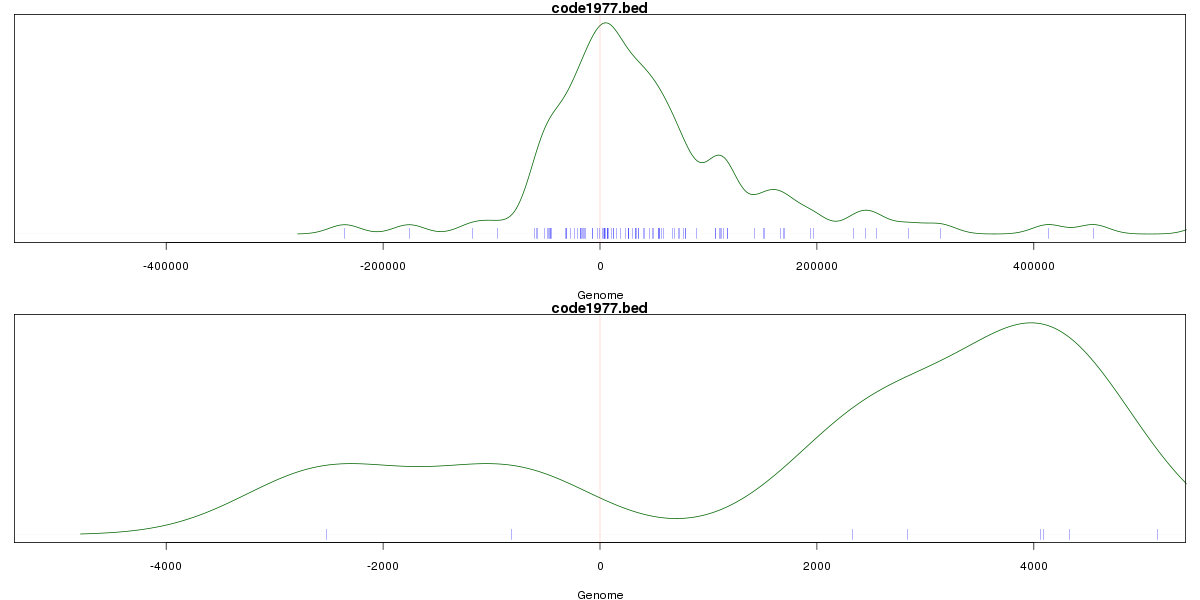
Stats
Number of sites: 163Promoter: 1%
CpG-Island: 0%
Conserved: 41%
Enriched Motifs & Matches
Match Detail: [Jaspar]
|
| ||
|---|---|---|
| Sites: 33/100 | e-val: 0.0000031 | ||
| Factor | e-val(match) | DB |
| Foxa2 | 0.0013764 | JASPAR |
| ARID3A | 0.0021377 | JASPAR |
| Lhx3 | 0.0023391 | JASPAR |
| FOXA1 | 0.0043792 | JASPAR |
| IRF1 | 0.0094684 | JASPAR |
|
| ||
| Sites: 24/100 | e-val: 0.006 | ||
| Factor | e-val(match) | DB |
| AP1 | 0.00000000094773 | JASPAR |
| NFE2L2 | 0.000000001561 | JASPAR |
| NFE2L1::MafG | 0.00011365 | JASPAR |
| PBX1 | 0.0021852 | JASPAR |
| Pax2 | 0.0063801 | JASPAR |
BED file downloads
Top 10 Example Regions
| Location | Gene Link | Dist. |
|---|---|---|
| chr1: 198095240-198095390 | RP11-401A10.2 | 65.2 |
| chr17: 62703120-62703270 | SMURF2 | 65.26 |
| chr17: 62703120-62703270 | hsa-mir-6080 | 65.26 |
| chr22: 30017800-30017950 | NF2 | 66.28 |
| chr5: 123991380-123991530 | RP11-436H11.3 | 67.75 |
| chr1: 172328860-172329010 | C1orf105 | 69.16 |
| chr5: 52327525-52327675 | ITGA2 | 70.92 |
| chr5: 52327525-52327675 | MOCS2 | 70.92 |
| chr1: 205703600-205703750 | SLC41A1 | 71.99 |
| chr1: 205703600-205703750 | SNORA72 | 71.99 |