SOM cluster: 20
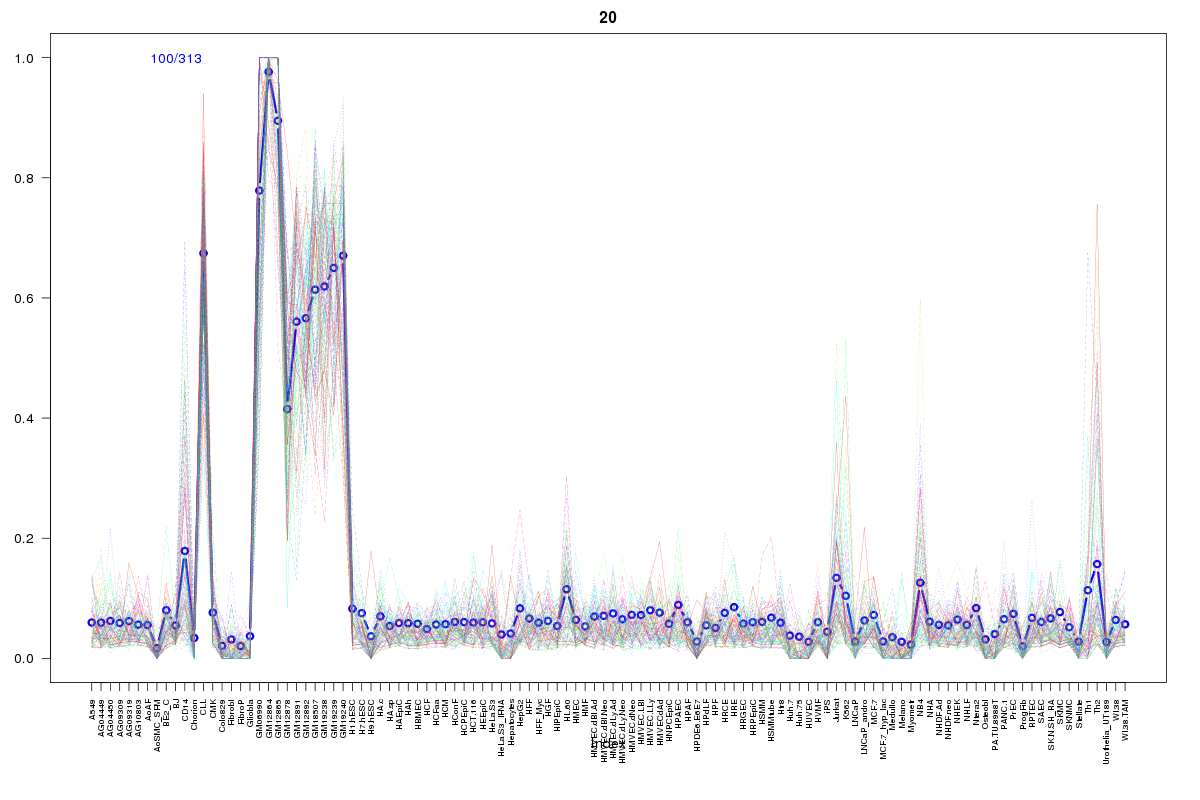
Cluster Hypersensitivity Profile

Genomic Location Trend
These plots show the distribution of the DHS sites surrounding the Transcript Start Site of the nearest gene.
Stats
Number of sites: 313Promoter: 1%
CpG-Island: 0%
Conserved: 36%
Enriched Motifs & Matches
Match Detail: [Jaspar]
|
| ||
|---|---|---|
| Sites: 58/100 | e-val: 0 | ||
| Factor | e-val(match) | DB |
| SPIB | 0.00000047599 | JASPAR |
| SPI1 | 0.000001109 | JASPAR |
| IRF1 | 0.00001219 | JASPAR |
| FEV | 0.00008829 | JASPAR |
| ELK4 | 0.00012286 | JASPAR |
BED file downloads
Top 10 Example Regions
| Location | Gene Link | Dist. |
|---|---|---|
| chr22: 39861520-39861670 | MIEF1 | 35.06 |
| chr22: 39861520-39861670 | MGAT3 | 35.06 |
| chr10: 12527400-12527550 | CAMK1D | 39.88 |
| chr17: 40738625-40738775 | HSD17B1 | 48.26 |
| chr17: 40738625-40738775 | PSMC3IP | 48.26 |
| chr17: 40738625-40738775 | CCR10 | 48.26 |
| chr18: 56428940-56429090 | MALT1 | 51.75 |
| chr10: 45929660-45929810 | ALOX5 | 52.73 |
| chr1: 21005300-21005450 | PINK1 | 52.75 |
| chr1: 21005300-21005450 | RP5-930J4.2 | 52.75 |