SOM cluster: 2041
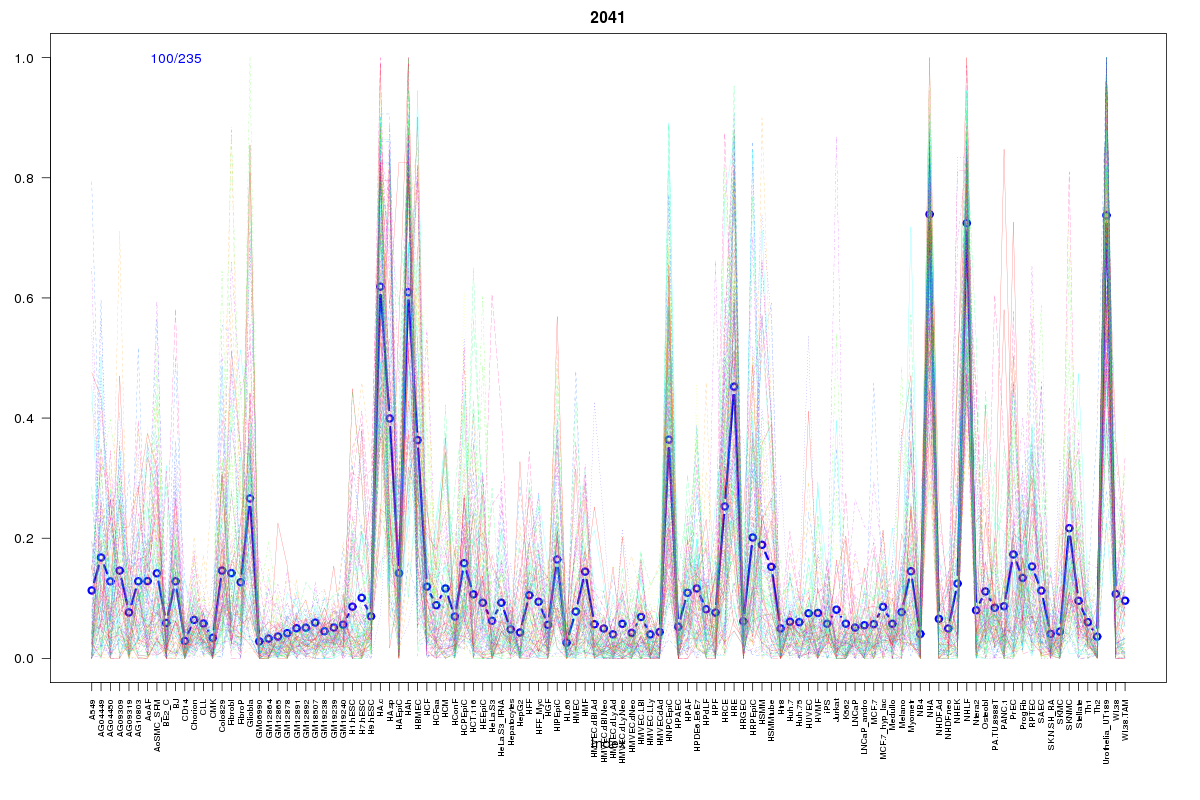
Cluster Hypersensitivity Profile

Genomic Location Trend
These plots show the distribution of the DHS sites surrounding the Transcript Start Site of the nearest gene.
Stats
Number of sites: 235Promoter: 0%
CpG-Island: 0%
Conserved: 40%
Enriched Motifs & Matches
Match Detail: [Jaspar]
|
| ||
|---|---|---|
| Sites: 37/100 | e-val: 9.6e-20 | ||
| Factor | e-val(match) | DB |
| RUNX1 | 0.000073444 | JASPAR |
| RREB1 | 0.0092309 | JASPAR |
| ZNF354C | 0.010942 | JASPAR |
| Foxq1 | 0.016513 | JASPAR |
| FOXO3 | 0.078411 | JASPAR |
|
| ||
| Sites: 28/100 | e-val: 0.00059 | ||
| Factor | e-val(match) | DB |
| AP1 | 0.00000000015264 | JASPAR |
| NFE2L2 | 0.000000010286 | JASPAR |
| PPARG | 0.0038529 | JASPAR |
| NFE2L1::MafG | 0.0048047 | JASPAR |
| PBX1 | 0.00581 | JASPAR |
BED file downloads
Top 10 Example Regions
| Location | Gene Link | Dist. |
|---|---|---|
| chr3: 159352320-159352470 | IQCJ-SCHIP1 | 41.2 |
| chr5: 146917920-146918070 | DPYSL3 | 54.2 |
| chr13: 114604280-114604430 | LINC00452 | 55.61 |
| chr5: 2656360-2656510 | IRX2 | 57.23 |
| chr2: 64582060-64582210 | AC114752.1 | 62.04 |
| chr19: 46610740-46610890 | IGFL3 | 62.32 |
| chr12: 6187620-6187770 | RN7SL69P | 69.73 |
| chr11: 115118240-115118390 | CADM1 | 75.76 |
| chr9: 104131680-104131830 | ALDOB | 76.63 |
| chr18: 5582940-5583090 | EPB41L3 | 80.48 |