SOM cluster: 2057
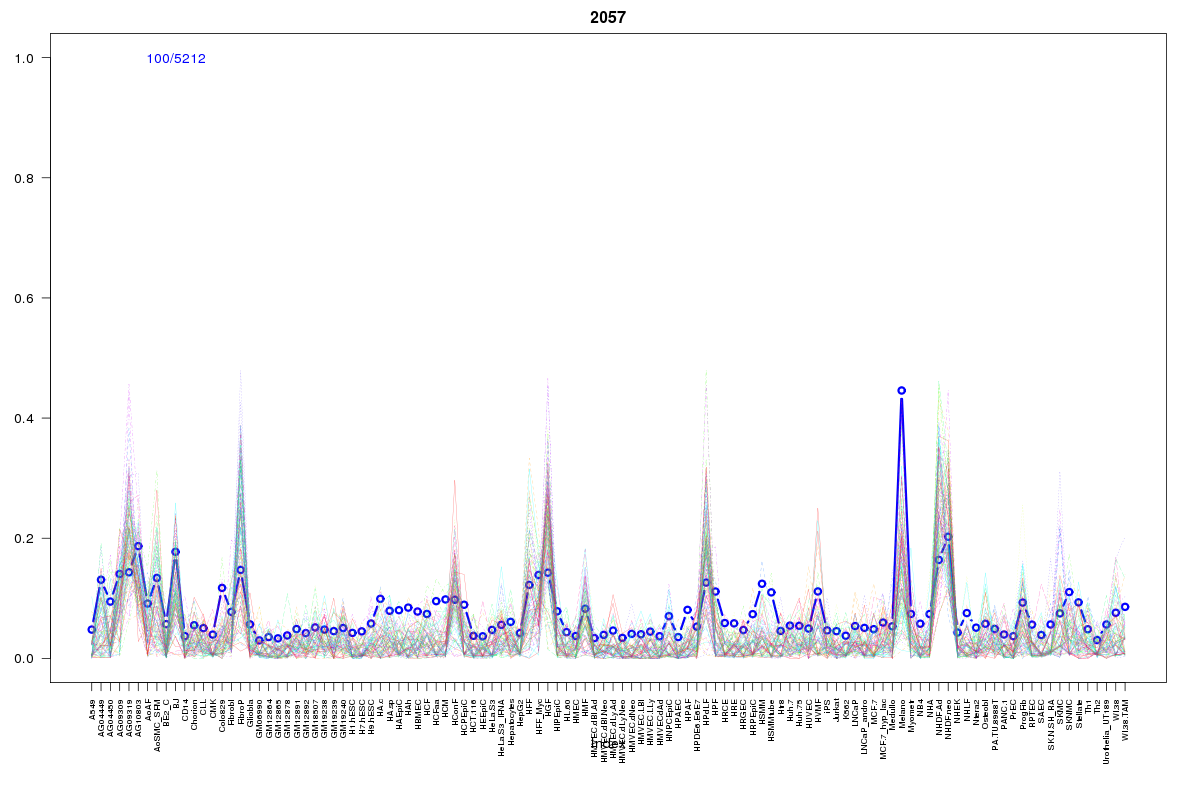
Cluster Hypersensitivity Profile

Genomic Location Trend
These plots show the distribution of the DHS sites surrounding the Transcript Start Site of the nearest gene.
Stats
Number of sites: 5212Promoter: 2%
CpG-Island: 0%
Conserved: 36%
Enriched Motifs & Matches
Match Detail: [Jaspar]
|
| ||
|---|---|---|
| Sites: 45/100 | e-val: 5.7e-30 | ||
| Factor | e-val(match) | DB |
| TAL1::TCF3 | 0.0000057966 | JASPAR |
| ARID3A | 0.0000061077 | JASPAR |
| Lhx3 | 0.000036637 | JASPAR |
| Prrx2 | 0.000074602 | JASPAR |
| HNF1A | 0.00018747 | JASPAR |
|
| ||
| Sites: 30/100 | e-val: 0.0000022 | ||
| Factor | e-val(match) | DB |
| HNF1B | 0.0000016149 | JASPAR |
| HNF1A | 0.0000066747 | JASPAR |
| ARID3A | 0.0001221 | JASPAR |
| Foxq1 | 0.00015883 | JASPAR |
| Lhx3 | 0.00033496 | JASPAR |
|
| ||
| Sites: 29/100 | e-val: 0.024 | ||
| Factor | e-val(match) | DB |
| NR3C1 | 0.00026395 | JASPAR |
| Pax4 | 0.00059774 | JASPAR |
| Prrx2 | 0.0026163 | JASPAR |
| Evi1 | 0.0060349 | JASPAR |
| MEF2A | 0.015001 | JASPAR |
BED file downloads
Top 10 Example Regions
| Location | Gene Link | Dist. |
|---|---|---|
| chr1: 146534620-146534770 | RP11-325P15.2 | 13.02 |
| chr8: 10077860-10078010 | MSRA | 28.98 |
| chr1: 92101265-92101415 | TGFBR3 | 32.3 |
| chr3: 173129300-173129450 | NLGN1 | 33.06 |
| chr3: 31677720-31677870 | STT3B | 37.7 |
| chr5: 175800205-175800355 | NOP16 | 39.59 |
| chr12: 1877880-1878030 | LRTM2 | 41.41 |
| chr3: 177245300-177245450 | LINC00578 | 43.16 |
| chr10: 6028460-6028610 | RP11-414H17.2 | 43.79 |
| chr10: 6028460-6028610 | RP11-536K7.5 | 43.79 |