SOM cluster: 2078
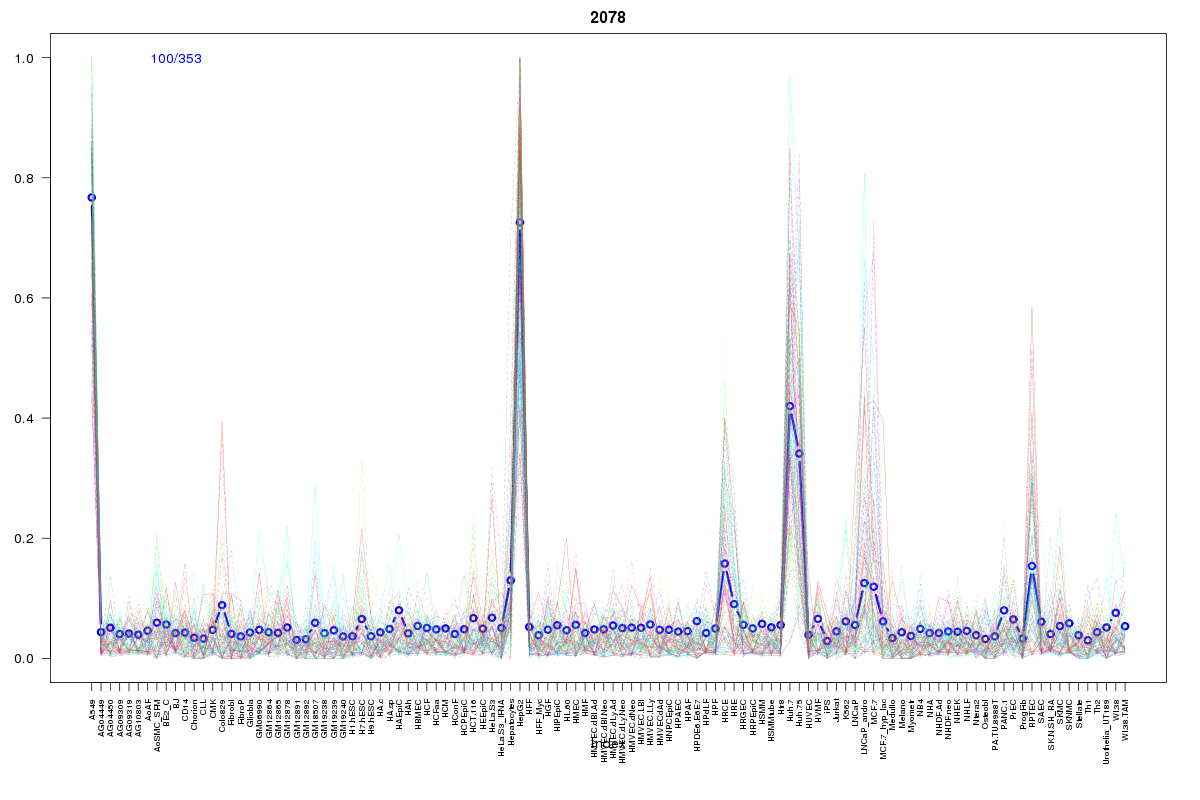
Cluster Hypersensitivity Profile

Genomic Location Trend
These plots show the distribution of the DHS sites surrounding the Transcript Start Site of the nearest gene.
Stats
Number of sites: 353Promoter: 8%
CpG-Island: 0%
Conserved: 50%
Enriched Motifs & Matches
Match Detail: [Jaspar]
|
| ||
|---|---|---|
| Sites: 41/100 | e-val: 0.000000000000001 | ||
| Factor | e-val(match) | DB |
| HNF1A | 0 | JASPAR |
| HNF1B | 6.6613e-16 | JASPAR |
| Lhx3 | 0.00000064032 | JASPAR |
| Prrx2 | 0.000088546 | JASPAR |
| NKX3-1 | 0.00039918 | JASPAR |
|
| ||
| Sites: 32/100 | e-val: 0.00000000043 | ||
| Factor | e-val(match) | DB |
| Foxd3 | 0.000000000019408 | JASPAR |
| FOXA1 | 0.000000000029727 | JASPAR |
| FOXI1 | 0.0000000011189 | JASPAR |
| Foxa2 | 0.000000030779 | JASPAR |
| Foxq1 | 0.000079483 | JASPAR |
|
| ||
| Sites: 19/100 | e-val: 0.15 | ||
| Factor | e-val(match) | DB |
| MEF2A | 0.0014237 | JASPAR |
| NFIL3 | 0.0018693 | JASPAR |
| ARID3A | 0.003342 | JASPAR |
| HNF1B | 0.008855 | JASPAR |
| NKX3-1 | 0.010646 | JASPAR |
BED file downloads
Top 10 Example Regions
| Location | Gene Link | Dist. |
|---|---|---|
| chr19: 35486540-35486690 | GRAMD1A | 41.7 |
| chr11: 13064540-13064690 | RASSF10 | 46.1 |
| chr1: 150640440-150640590 | HORMAD1 | 46.54 |
| chr3: 31245625-31245775 | AC115283.1 | 50.15 |
| chr11: 57209480-57209630 | SLC43A3 | 55.01 |
| chr11: 57209480-57209630 | RP11-872D17.8 | 55.01 |
| chr2: 165567540-165567690 | GRB14 | 57.19 |
| chr11: 27423640-27423790 | LGR4 | 58.02 |
| chr3: 12263305-12263455 | PPARG | 58.49 |
| chr8: 17764880-17765030 | RP11-156K13.1 | 59.09 |