SOM cluster: 2080
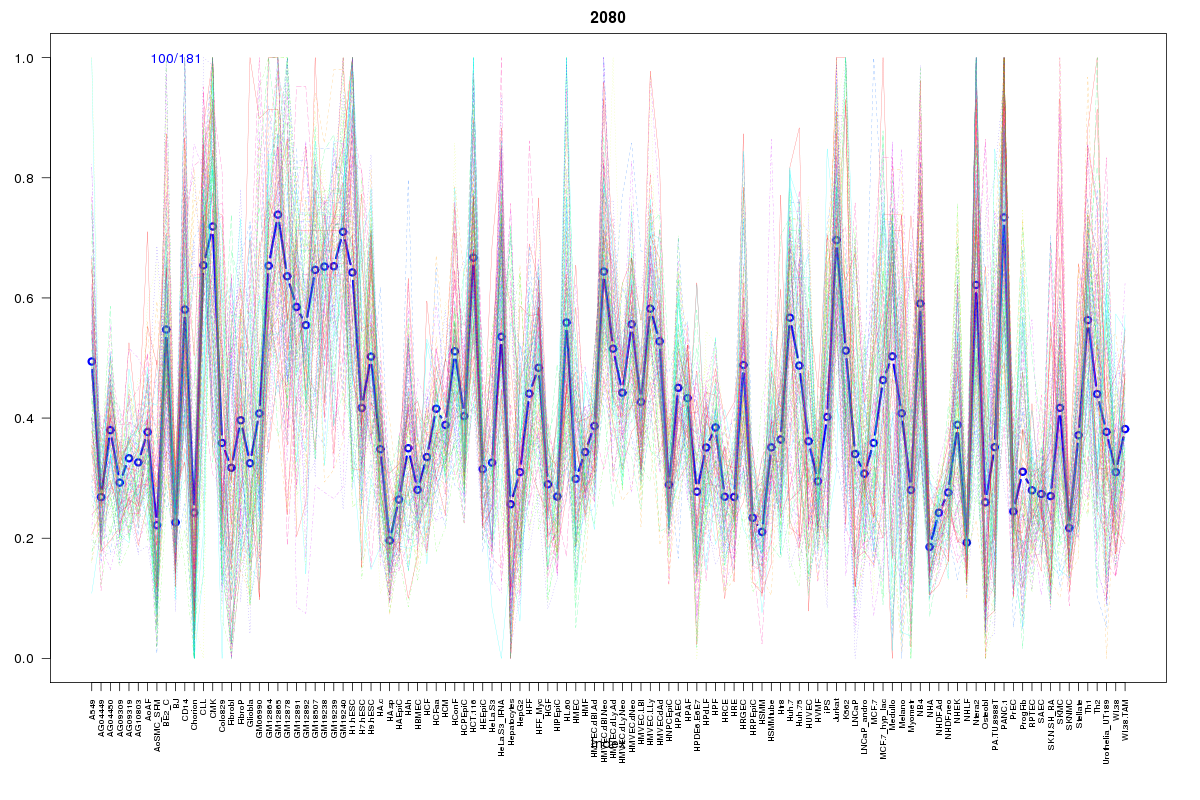
Cluster Hypersensitivity Profile

Genomic Location Trend
These plots show the distribution of the DHS sites surrounding the Transcript Start Site of the nearest gene.
Stats
Number of sites: 181Promoter: 6%
CpG-Island: 0%
Conserved: 56%
Enriched Motifs & Matches
Match Detail: [Jaspar]
|
| ||
|---|---|---|
| Sites: 70/100 | e-val: 0 | ||
| Factor | e-val(match) | DB |
| CTCF | 5.5511e-16 | JASPAR |
| INSM1 | 0.00000042514 | JASPAR |
| SP1 | 0.00090699 | JASPAR |
| MYC::MAX | 0.0019712 | JASPAR |
| Zfp423 | 0.0059752 | JASPAR |
BED file downloads
Top 10 Example Regions
| Location | Gene Link | Dist. |
|---|---|---|
| chr1: 150138300-150138450 | PLEKHO1 | 13.02 |
| chr1: 26865300-26865450 | RPS6KA1 | 47.17 |
| chr22: 22326760-22326910 | TOP3B | 47.21 |
| chr2: 170384860-170385010 | PPIG | 55.32 |
| chr3: 141193180-141193330 | RASA2 | 56.03 |
| chr3: 141193180-141193330 | RASA2-IT1 | 56.03 |
| chr9: 138494640-138494790 | MRPS2 | 57.05 |
| chrX: 70475100-70475250 | NONO | 59.43 |
| chr19: 10339645-10339795 | RAVER1 | 62.41 |
| chr19: 10339645-10339795 | ZGLP1 | 62.41 |