SOM cluster: 211
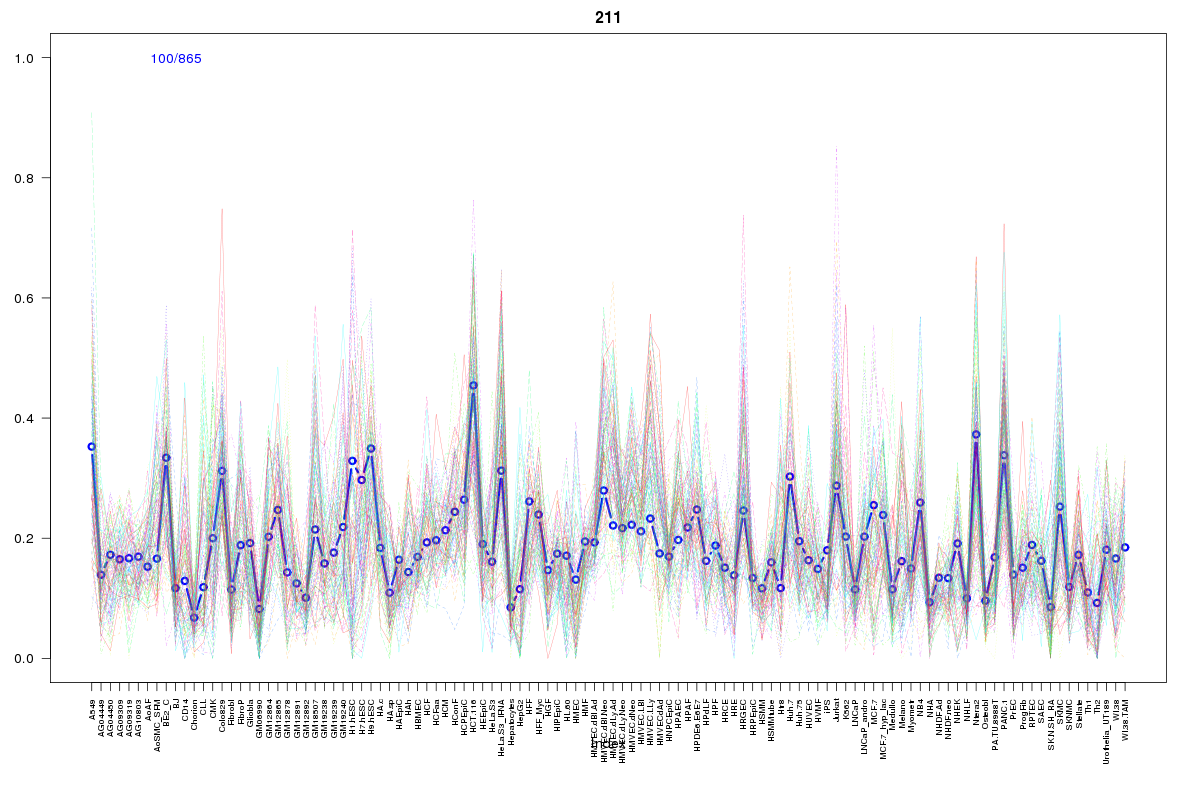
Cluster Hypersensitivity Profile

Genomic Location Trend
These plots show the distribution of the DHS sites surrounding the Transcript Start Site of the nearest gene.
Stats
Number of sites: 865Promoter: 1%
CpG-Island: 0%
Conserved: 51%
Enriched Motifs & Matches
Match Detail: [Jaspar]
|
| ||
|---|---|---|
| Sites: 62/100 | e-val: 0 | ||
| Factor | e-val(match) | DB |
| CTCF | 0.0000000000012632 | JASPAR |
| INSM1 | 0.0002784 | JASPAR |
| Zfp423 | 0.0015827 | JASPAR |
| T | 0.0048508 | JASPAR |
| PLAG1 | 0.0098685 | JASPAR |
BED file downloads
Top 10 Example Regions
| Location | Gene Link | Dist. |
|---|---|---|
| chr8: 121358080-121358230 | MRPL13 | 27.96 |
| chr2: 60792720-60792870 | BCL11A | 38.68 |
| chr1: 82015280-82015430 | RP5-837I24.4 | 50.09 |
| chr12: 102563780-102563930 | PMCH | 52.35 |
| chr9: 133745480-133745630 | ABL1 | 53.38 |
| chrX: 62726320-62726470 | RP11-357C3.3 | 54.76 |
| chr6: 52860980-52861130 | GSTA3 | 55.27 |
| chr19: 49012885-49013035 | CYTH2 | 55.34 |
| chr19: 49012885-49013035 | GRIN2D | 55.34 |
| chr19: 49012885-49013035 | KCNJ14 | 55.34 |