SOM cluster: 2136
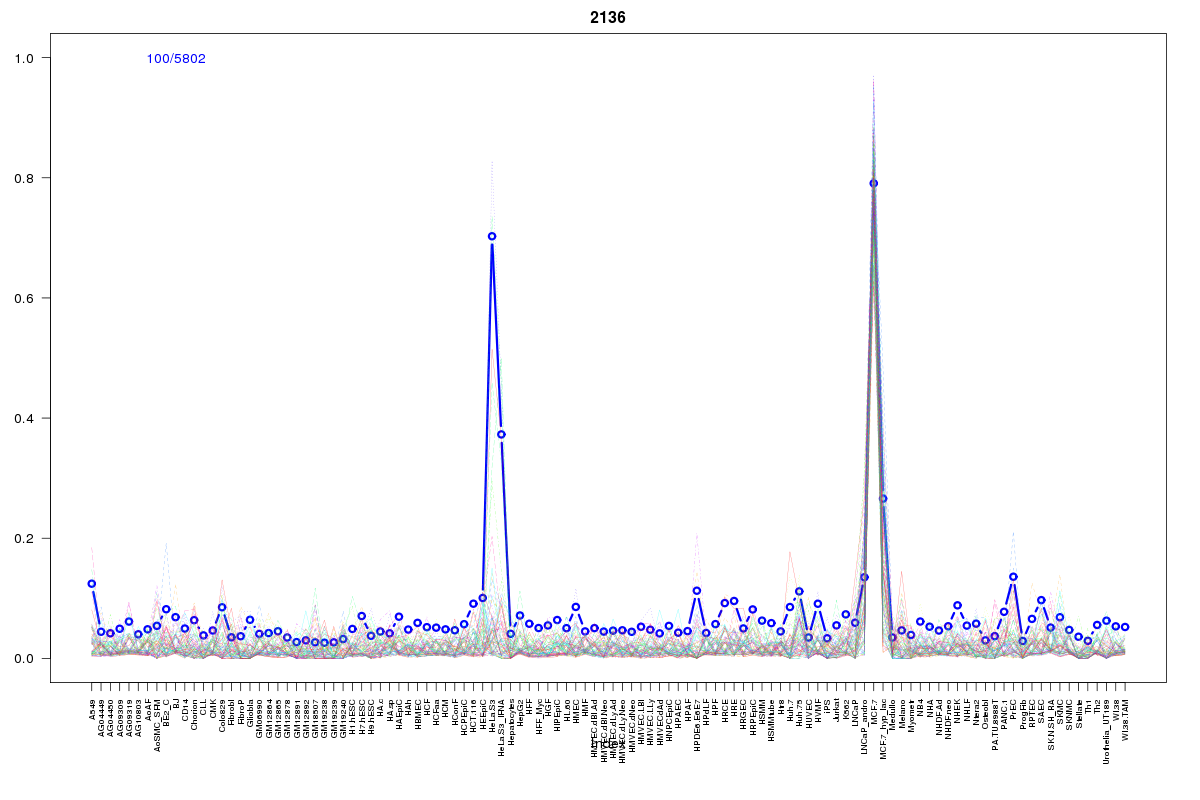
Cluster Hypersensitivity Profile

Genomic Location Trend
These plots show the distribution of the DHS sites surrounding the Transcript Start Site of the nearest gene.
Stats
Number of sites: 5802Promoter: 0%
CpG-Island: 0%
Conserved: 17%
Enriched Motifs & Matches
Match Detail: [Jaspar]
|
| ||
|---|---|---|
| Sites: 19/100 | e-val: 0.0000006 | ||
| Factor | e-val(match) | DB |
| FOXA1 | 0.000000037428 | JASPAR |
| FOXI1 | 0.00000049807 | JASPAR |
| Foxa2 | 0.0000010137 | JASPAR |
| Foxd3 | 0.0000098393 | JASPAR |
| Lhx3 | 0.000038157 | JASPAR |
BED file downloads
Top 10 Example Regions
| Location | Gene Link | Dist. |
|---|---|---|
| chr1: 145424580-145424730 | LIX1L | 15.14 |
| chr9: 138295605-138295755 | C9orf116 | 37.21 |
| chr16: 27936600-27936750 | RNU6-159P | 39.34 |
| chr1: 151551560-151551710 | RP11-404E16.1 | 39.42 |
| chr3: 124786220-124786370 | SLC12A8 | 43.22 |
| chr3: 52366700-52366850 | TWF2 | 44.35 |
| chr19: 13995840-13995990 | MIR181C | 47.61 |
| chr17: 56980700-56980850 | TRIM37 | 49.29 |
| chr1: 151521185-151521335 | TUFT1 | 49.32 |
| chr1: 151521185-151521335 | SNX27 | 49.32 |