SOM cluster: 2142
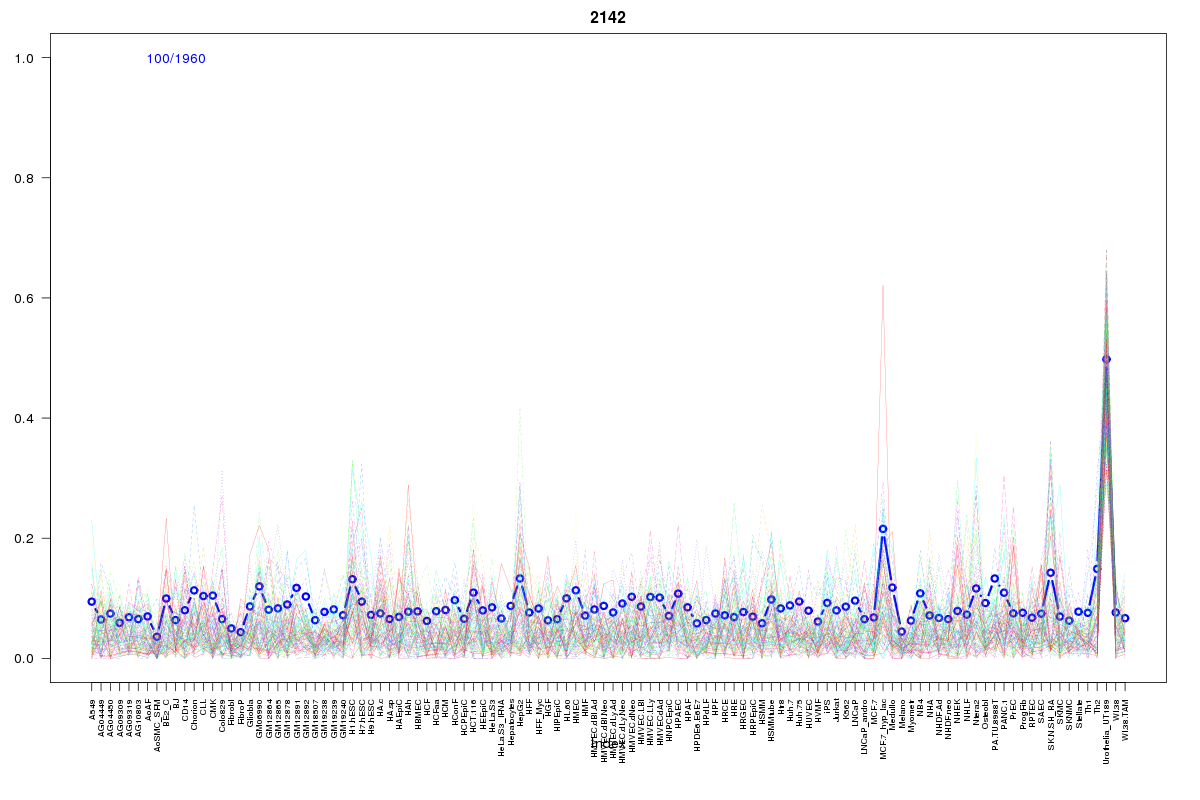
Cluster Hypersensitivity Profile

Genomic Location Trend
These plots show the distribution of the DHS sites surrounding the Transcript Start Site of the nearest gene.
Stats
Number of sites: 1960Promoter: 2%
CpG-Island: 13%
Conserved: 19%
Enriched Motifs & Matches
Match Detail: [Jaspar]
|
| ||
|---|---|---|
| Sites: 44/100 | e-val: 0.0000000000049 | ||
| Factor | e-val(match) | DB |
| Tcfcp2l1 | 0.001635 | JASPAR |
| BRCA1 | 0.0018305 | JASPAR |
| SP1 | 0.016213 | JASPAR |
| E2F1 | 0.030785 | JASPAR |
| ZNF354C | 0.036798 | JASPAR |
BED file downloads
Top 10 Example Regions
| Location | Gene Link | Dist. |
|---|---|---|
| chr1: 151033460-151033610 | RP11-316M1.3 | 24.74 |
| chr1: 151033460-151033610 | MLLT11 | 24.74 |
| chr17: 73585905-73586055 | SAP30BP | 42.85 |
| chr3: 31771325-31771475 | ZNF587P1 | 45.94 |
| chrX: 51075040-51075190 | NUDT10 | 46.7 |
| chrX: 51075040-51075190 | CXorf67 | 46.7 |
| chr1: 145683545-145683695 | RNF115 | 47.88 |
| chr17: 62045440-62045590 | GH2 | 49.55 |
| chr17: 62045440-62045590 | CSH2 | 49.55 |
| chr22: 20789285-20789435 | Y_RNA | 53.08 |