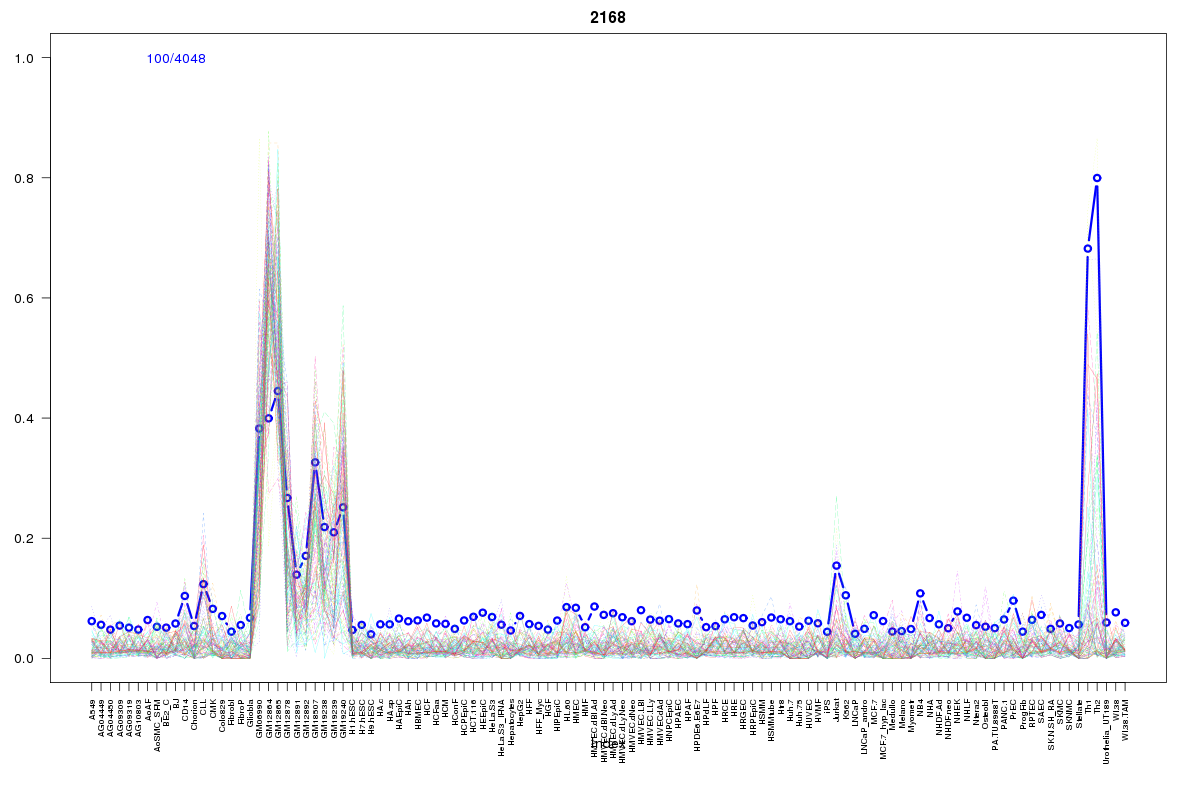
SOM cluster: 2168
Cluster Hypersensitivity Profile

Genomic Location Trend
These plots show the distribution of the DHS sites surrounding the Transcript Start Site of the nearest gene.
Stats
Number of sites: 4048Promoter: 1%
CpG-Island: 0%
Conserved: 21%
Enriched Motifs & Matches
No motifs found.BED file downloads
Top 10 Example Regions
| Location | Gene Link | Dist. |
|---|---|---|
| chr1: 150539700-150539850 | TARS2 | 12.94 |
| chr1: 150539700-150539850 | ENSA | 12.94 |
| chr1: 150048240-150048390 | PLEKHO1 | 17.01 |
| chr1: 145606580-145606730 | RBM8A | 22.39 |
| chr1: 145606580-145606730 | POLR3C | 22.39 |
| chr1: 145606580-145606730 | RP11-315I20.1 | 22.39 |
| chr3: 128166745-128166895 | GATA2 | 33.98 |
| chr8: 59925300-59925450 | TOX | 34.34 |
| chr1: 157493885-157494035 | FCRL5 | 38.23 |
| chr1: 209897485-209897635 | TRAF3IP3 | 38.49 |