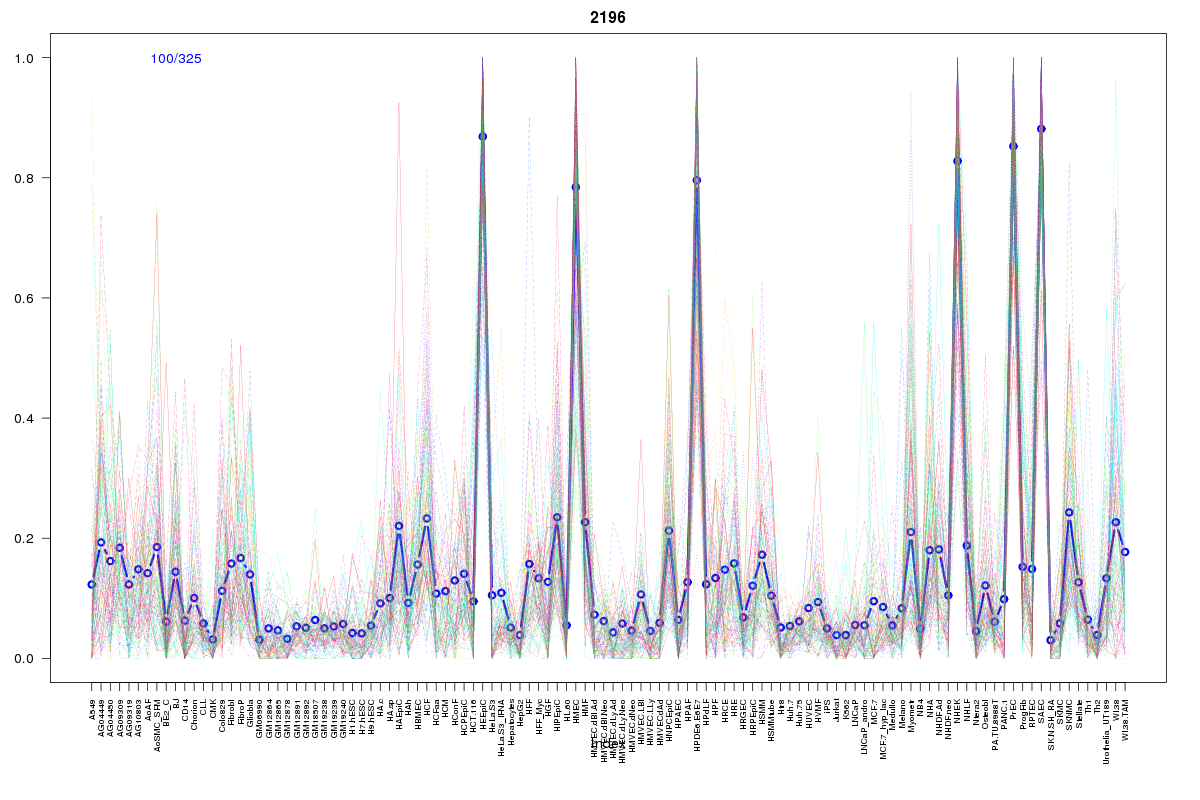
SOM cluster: 2196
Cluster Hypersensitivity Profile

Genomic Location Trend
These plots show the distribution of the DHS sites surrounding the Transcript Start Site of the nearest gene.
Stats
Number of sites: 325Promoter: 1%
CpG-Island: 0%
Conserved: 33%
Enriched Motifs & Matches
Match Detail: [Jaspar]
|
| ||
|---|---|---|
| Sites: 44/100 | e-val: 0.000000019 | ||
| Factor | e-val(match) | DB |
| AP1 | 0.000000000088805 | JASPAR |
| NFE2L2 | 0.0000000061752 | JASPAR |
| NFE2L1::MafG | 0.0047506 | JASPAR |
| PPARG | 0.0047636 | JASPAR |
| Foxa2 | 0.0099824 | JASPAR |
|
| ||
| Sites: 14/100 | e-val: 0.037 | ||
| Factor | e-val(match) | DB |
| TP53 | 0.0029751 | JASPAR |
| FOXD1 | 0.015673 | JASPAR |
| Tcfcp2l1 | 0.016157 | JASPAR |
| FOXO3 | 0.016717 | JASPAR |
| Foxq1 | 0.0242 | JASPAR |
BED file downloads
Top 10 Example Regions
| Location | Gene Link | Dist. |
|---|---|---|
| chr1: 151144720-151144870 | PIP5K1A | 20.09 |
| chr1: 151144720-151144870 | SEMA6C | 20.09 |
| chr13: 42600300-42600450 | RPS28P8 | 44.96 |
| chr12: 28186600-28186750 | PTHLH | 47.82 |
| chr12: 28186600-28186750 | CCDC91 | 47.82 |
| chr12: 28186600-28186750 | RP11-993B23.3 | 47.82 |
| chr1: 152224780-152224930 | RPTN | 48.33 |
| chr1: 152224780-152224930 | FLG-AS1 | 48.33 |
| chr18: 3346120-3346270 | TGIF1 | 52.44 |
| chr1: 209607060-209607210 | MIR205HG | 55.78 |