SOM cluster: 2215
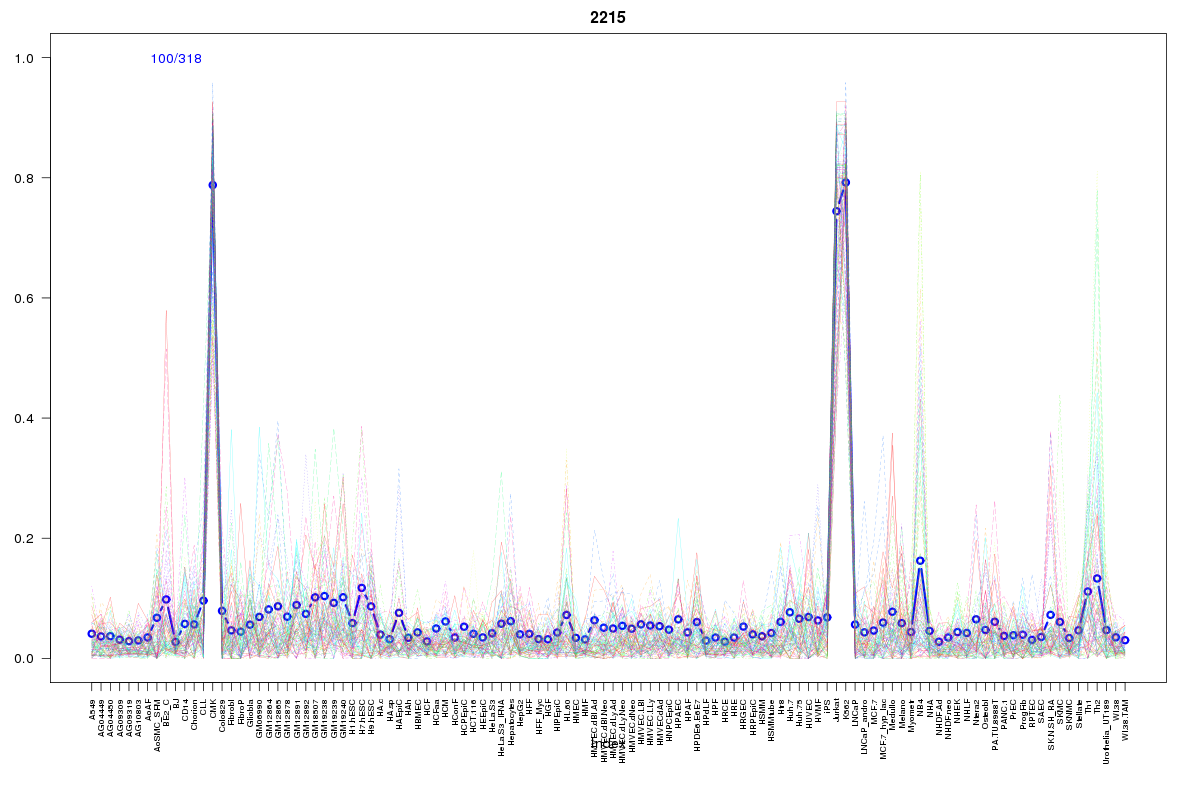
Cluster Hypersensitivity Profile

Genomic Location Trend
These plots show the distribution of the DHS sites surrounding the Transcript Start Site of the nearest gene.
Stats
Number of sites: 318Promoter: 7%
CpG-Island: 0%
Conserved: 30%
Enriched Motifs & Matches
Match Detail: [Jaspar]
|
| ||
|---|---|---|
| Sites: 53/100 | e-val: 0.000000000000026 | ||
| Factor | e-val(match) | DB |
| Evi1 | 0.000000051049 | JASPAR |
| Gata1 | 0.0000004862 | JASPAR |
| Tal1::Gata1 | 0.001561 | JASPAR |
| GATA2 | 0.0064526 | JASPAR |
| SRF | 0.01139 | JASPAR |
BED file downloads
Top 10 Example Regions
| Location | Gene Link | Dist. |
|---|---|---|
| chr9: 37679080-37679230 | TOMM5 | 49.34 |
| chr1: 89760960-89761110 | RP4-620F22.2 | 52.5 |
| chr2: 74263680-74263830 | DGUOK-AS1 | 62.58 |
| chr2: 74263680-74263830 | RP11-711M9.1 | 62.58 |
| chr12: 120103520-120103670 | PRKAB1 | 64.58 |
| chr8: 66580220-66580370 | ARMC1 | 64.78 |
| chr19: 52050980-52051130 | ZNF175 | 65.14 |
| chr19: 52050980-52051130 | SIGLEC12 | 65.14 |
| chr19: 52050980-52051130 | SIGLEC6 | 65.14 |
| chr9: 131355480-131355630 | SPTAN1 | 65.71 |