SOM cluster: 2230
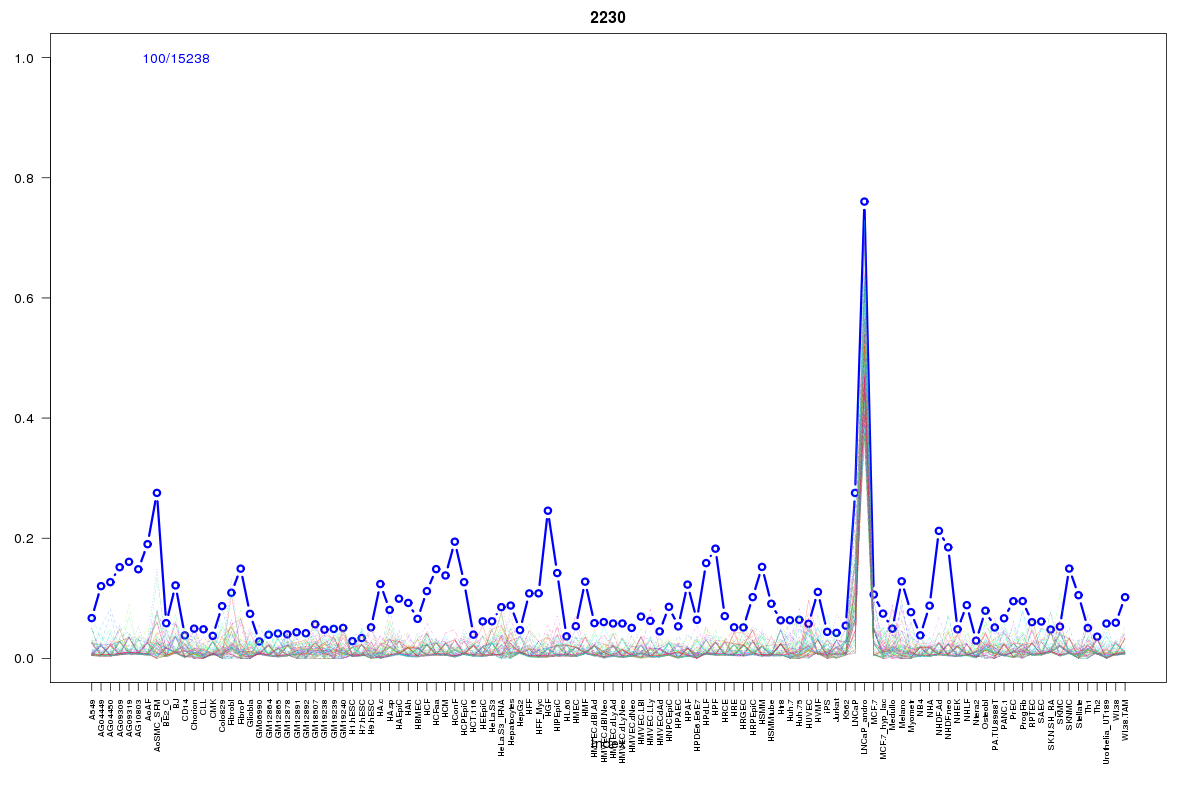
Cluster Hypersensitivity Profile

Genomic Location Trend
These plots show the distribution of the DHS sites surrounding the Transcript Start Site of the nearest gene.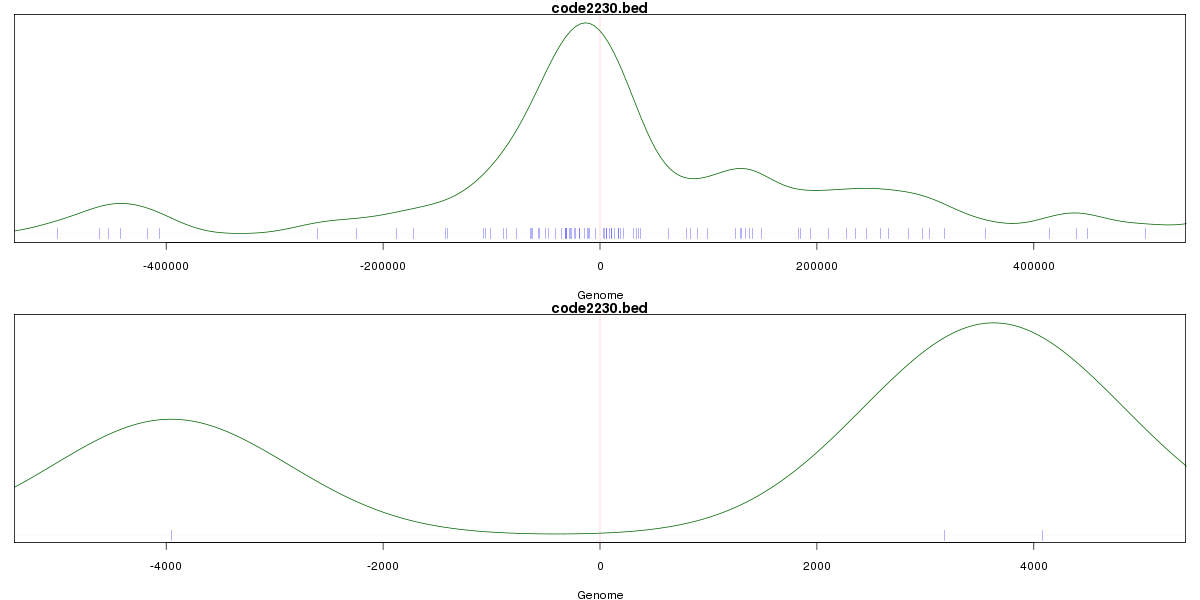
Stats
Number of sites: 15238Promoter: 0%
CpG-Island: 0%
Conserved: 13%
Enriched Motifs & Matches
Match Detail: [Jaspar]
|
| ||
|---|---|---|
| Sites: 30/100 | e-val: 0.00000000000014 | ||
| Factor | e-val(match) | DB |
| Foxd3 | 0.0000000073985 | JASPAR |
| HNF1B | 0.00000016411 | JASPAR |
| Foxq1 | 0.0000030103 | JASPAR |
| HNF1A | 0.000019407 | JASPAR |
| Lhx3 | 0.000023099 | JASPAR |
BED file downloads
Top 10 Example Regions
| Location | Gene Link | Dist. |
|---|---|---|
| chr1: 145435480-145435630 | GNRHR2 | 13.02 |
| chr17: 17853780-17853930 | ATPAF2 | 26.32 |
| chr1: 150927860-150928010 | ANXA9 | 32.56 |
| chr8: 85159240-85159390 | RALYL | 36.25 |
| chr8: 10678845-10678995 | RP11-177H2.2 | 37.01 |
| chr1: 203840720-203840870 | CBX1P3 | 41.86 |
| chr1: 203840720-203840870 | RP11-397P13.6 | 41.86 |
| chr7: 140116460-140116610 | RAB19 | 42.62 |
| chr4: 89802200-89802350 | FAM13A | 42.73 |
| chr7: 45909900-45910050 | AC096582.9 | 43.98 |