SOM cluster: 2251
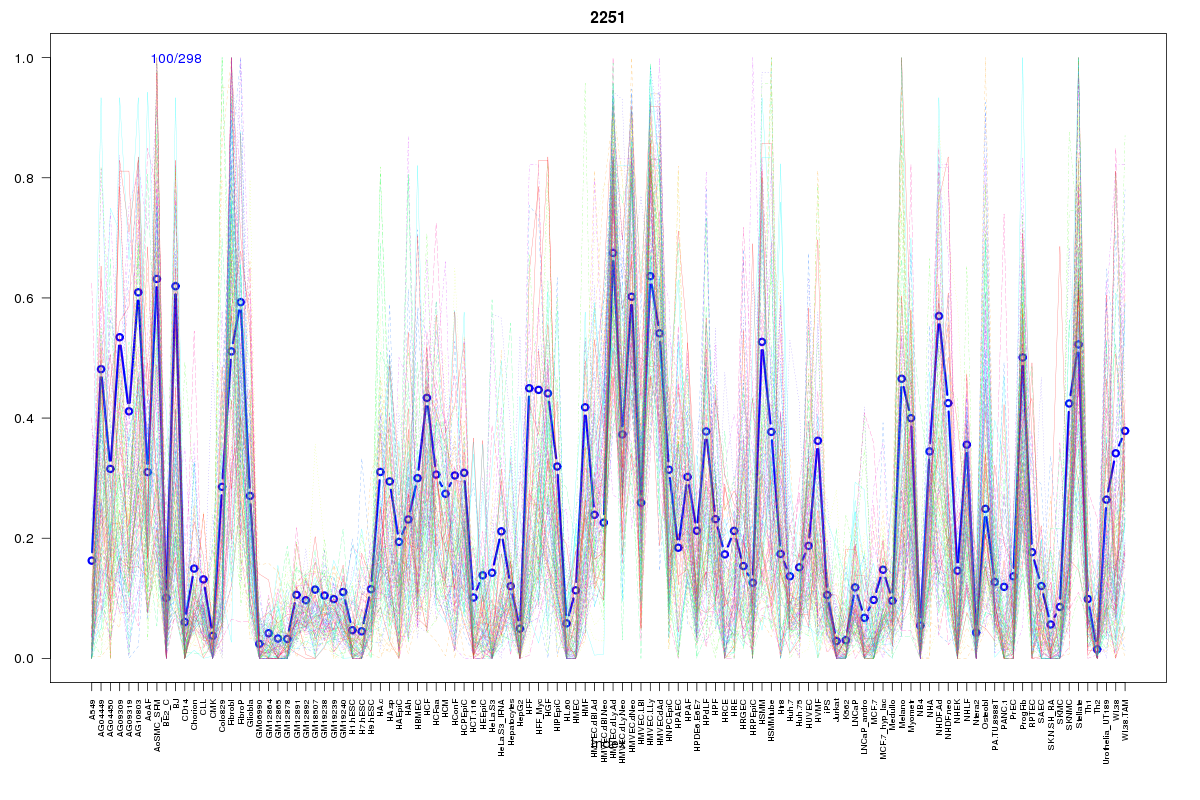
Cluster Hypersensitivity Profile

Genomic Location Trend
These plots show the distribution of the DHS sites surrounding the Transcript Start Site of the nearest gene.
Stats
Number of sites: 298Promoter: 3%
CpG-Island: 0%
Conserved: 44%
Enriched Motifs & Matches
Match Detail: [Jaspar]
|
| ||
|---|---|---|
| Sites: 14/100 | e-val: 0.0052 | ||
| Factor | e-val(match) | DB |
| Sox2 | 0.000002973 | JASPAR |
| NFATC2 | 0.00010368 | JASPAR |
| Pou5f1 | 0.00011257 | JASPAR |
| FOXI1 | 0.010751 | JASPAR |
| Foxa2 | 0.011047 | JASPAR |
BED file downloads
Top 10 Example Regions
| Location | Gene Link | Dist. |
|---|---|---|
| chr17: 17804405-17804555 | TOM1L2 | 28.9 |
| chr8: 22458120-22458270 | C8orf58 | 35.97 |
| chr8: 22458120-22458270 | SORBS3 | 35.97 |
| chr8: 22458120-22458270 | AC037459.4 | 35.97 |
| chr8: 22458120-22458270 | PDLIM2 | 35.97 |
| chr8: 22458120-22458270 | CCAR2 | 35.97 |
| chr9: 104218240-104218390 | MRPL50 | 50.34 |
| chr9: 104218240-104218390 | TRMT112P4 | 50.34 |
| chr11: 75058340-75058490 | RPS3 | 50.49 |
| chr11: 75058340-75058490 | SNORD15A | 50.49 |