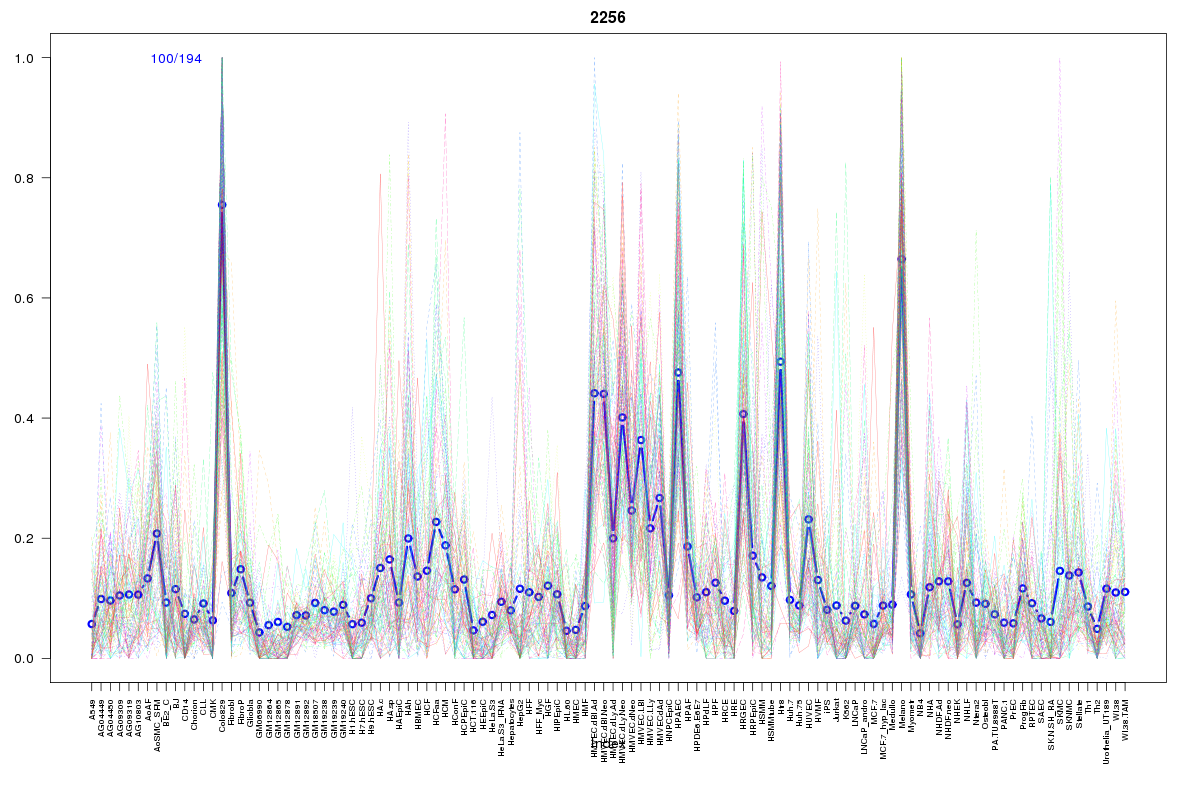
SOM cluster: 2256
Cluster Hypersensitivity Profile

Genomic Location Trend
These plots show the distribution of the DHS sites surrounding the Transcript Start Site of the nearest gene.
Stats
Number of sites: 194Promoter: 2%
CpG-Island: 0%
Conserved: 69%
Enriched Motifs & Matches
Match Detail: [Jaspar]
|
| ||
|---|---|---|
| Sites: 25/100 | e-val: 0.00045 | ||
| Factor | e-val(match) | DB |
| NFATC2 | 0.00032305 | JASPAR |
| FEV | 0.0049497 | JASPAR |
| SPI1 | 0.015269 | JASPAR |
| Sox2 | 0.016849 | JASPAR |
| SPIB | 0.017695 | JASPAR |
BED file downloads
Top 10 Example Regions
| Location | Gene Link | Dist. |
|---|---|---|
| chr15: 101631745-101631895 | CHSY1 | 39.76 |
| chr13: 49138300-49138450 | LINC00462 | 42.62 |
| chr17: 17832140-17832290 | TOM1L2 | 49.42 |
| chr2: 136718900-136719050 | DARS | 54.7 |
| chr2: 178030460-178030610 | HNRNPA3 | 55.54 |
| chr2: 178030460-178030610 | NFE2L2 | 55.54 |
| chr7: 104604040-104604190 | KMT2E | 62.76 |
| chr7: 104604040-104604190 | KMT2E-AS1 | 62.76 |
| chr1: 208115720-208115870 | PLXNA2 | 63.48 |
| chr1: 208115720-208115870 | CD34 | 63.48 |