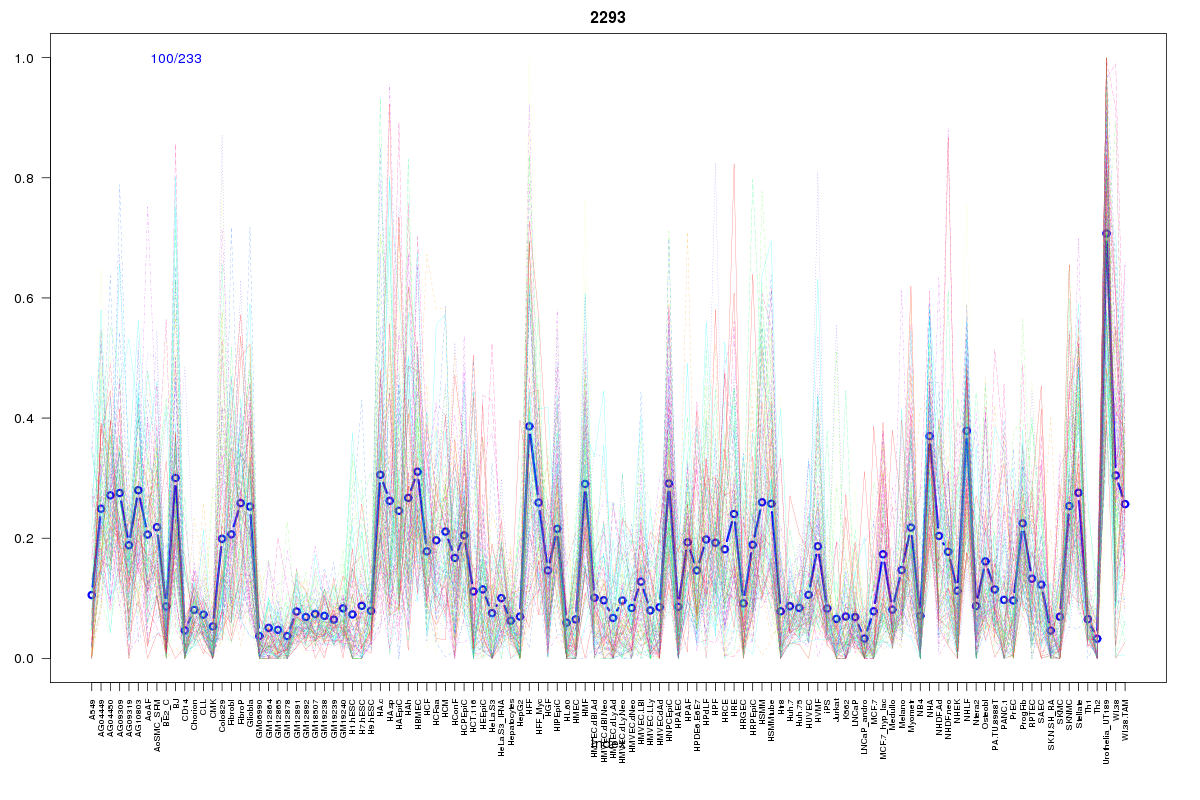
SOM cluster: 2293
Cluster Hypersensitivity Profile

Genomic Location Trend
These plots show the distribution of the DHS sites surrounding the Transcript Start Site of the nearest gene.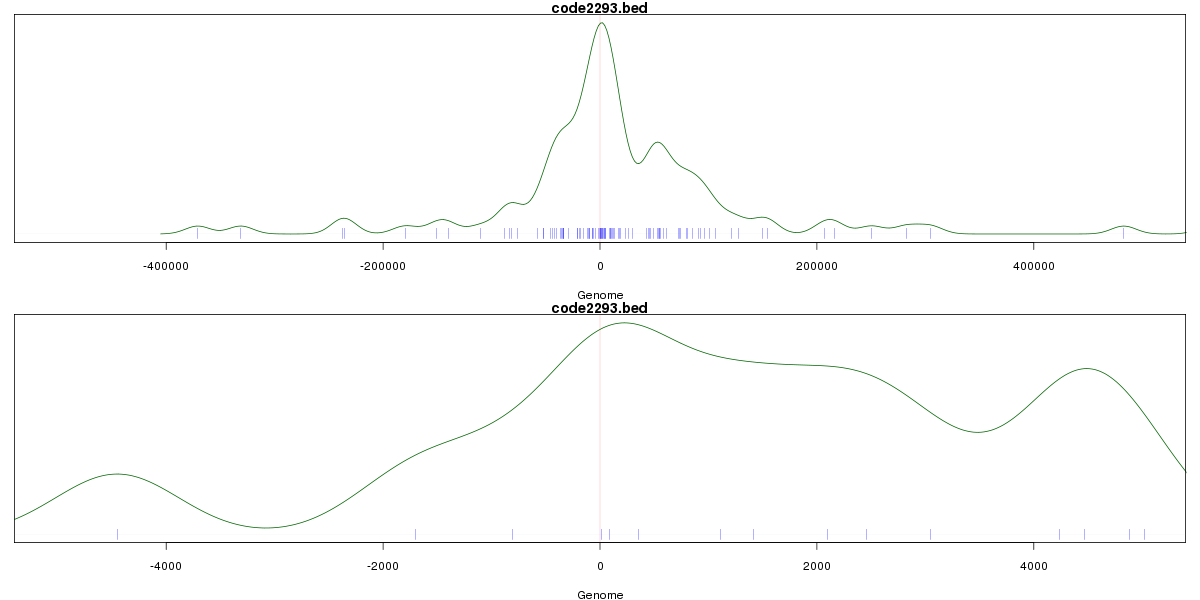
Stats
Number of sites: 233Promoter: 3%
CpG-Island: 2%
Conserved: 26%
Enriched Motifs & Matches
Match Detail: [Jaspar]
|
| ||
|---|---|---|
| Sites: 20/100 | e-val: 0.00055 | ||
| Factor | e-val(match) | DB |
| AP1 | 0.0000000060684 | JASPAR |
| NFE2L2 | 0.000058544 | JASPAR |
| TEAD1 | 0.015245 | JASPAR |
| Pdx1 | 0.01667 | JASPAR |
| NFE2L1::MafG | 0.029701 | JASPAR |
BED file downloads
Top 10 Example Regions
| Location | Gene Link | Dist. |
|---|---|---|
| chr8: 120106300-120106450 | MAL2 | 39.24 |
| chr8: 42056300-42056450 | PLAT | 50.85 |
| chrX: 47375760-47375910 | TIMP1 | 64.61 |
| chr13: 23951960-23952110 | SACS | 66.24 |
| chr5: 10527700-10527850 | ROPN1L-AS1 | 69.15 |
| chr22: 27536420-27536570 | RP5-1172A22.1 | 73.58 |
| chr22: 27536420-27536570 | CTA-992D9.7 | 73.58 |
| chr10: 33405360-33405510 | RP11-462L8.2 | 74.58 |
| chr14: 24017660-24017810 | AP1G2 | 76.15 |
| chr6: 52908980-52909130 | RN7SL244P | 77.02 |