SOM cluster: 230
Cluster Hypersensitivity Profile

Genomic Location Trend
These plots show the distribution of the DHS sites surrounding the Transcript Start Site of the nearest gene.
Stats
Number of sites: 175Promoter: 49%
CpG-Island: 88%
Conserved: 59%
Enriched Motifs & Matches
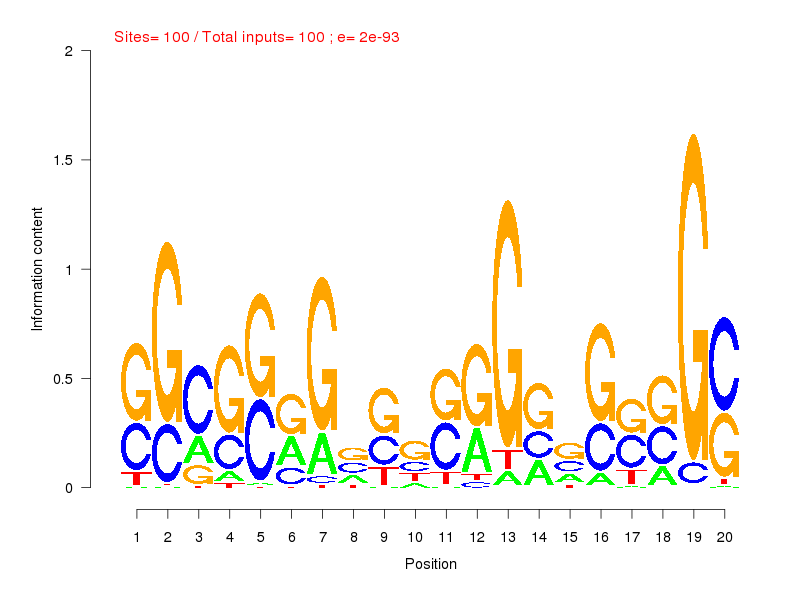
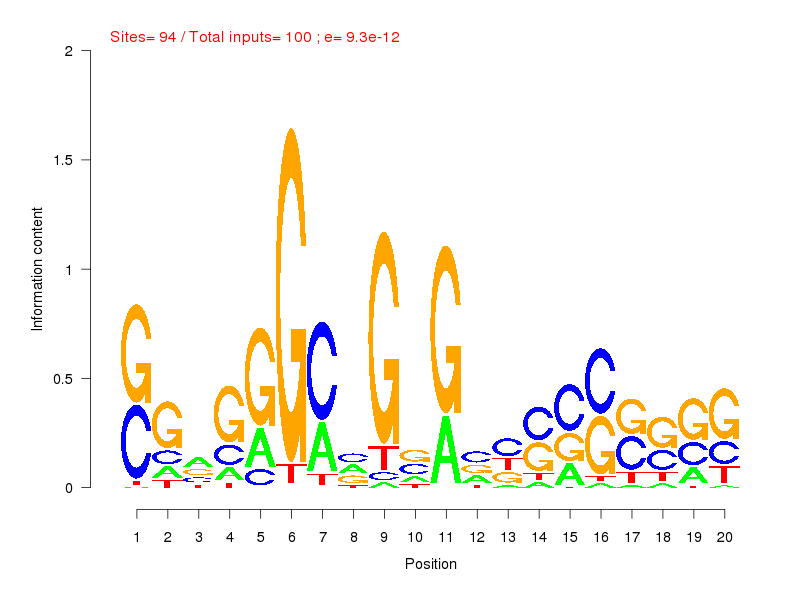
Match Detail: [Jaspar]

| ||
|---|---|---|
| Sites: 100/100 | e-val: 0 | ||
| Factor | e-val(match) | DB |
| SP1 | 0.0000018741 | JASPAR |
| TFAP2A | 0.00046249 | JASPAR |
| Egr1 | 0.0074129 | JASPAR |
| PLAG1 | 0.01025 | JASPAR |
| Klf4 | 0.040262 | JASPAR |

| ||
| Sites: 94/100 | e-val: 0.0000000000093 | ||
| Factor | e-val(match) | DB |
| SP1 | 0.000006348 | JASPAR |
| TFAP2A | 0.0024881 | JASPAR |
| Klf4 | 0.0037843 | JASPAR |
| PLAG1 | 0.0056097 | JASPAR |
| EWSR1-FLI1 | 0.0059046 | JASPAR |
BED file downloads
Top 10 Example Regions
| Location | Gene Link | Dist. |
|---|---|---|
| chr9: 132815885-132816035 | AL360004.1 | 44.52 |
| chr16: 11350300-11350450 | Y_RNA | 47.83 |
| chr16: 11350300-11350450 | RMI2 | 47.83 |
| chr17: 58469160-58469310 | C17orf64 | 50.23 |
| chr19: 30336120-30336270 | CCNE1 | 54.31 |
| chr17: 62971380-62971530 | GNA13 | 62.15 |
| chr7: 99933880-99934030 | PVRIG2P | 62.92 |
| chr7: 99933880-99934030 | STAG3L5P | 62.92 |
| chr7: 99933880-99934030 | PILRB | 62.92 |
| chr14: 50779120-50779270 | ATP5S | 64.94 |