SOM cluster: 2300
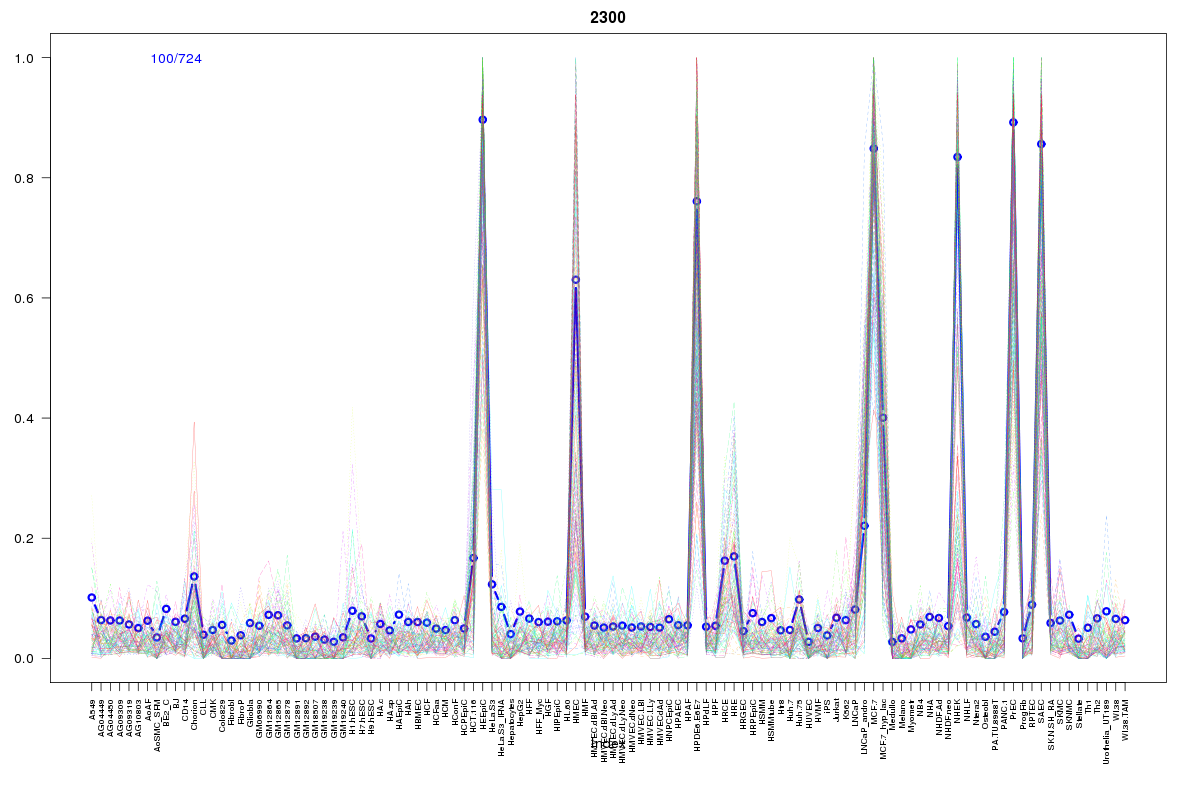
Cluster Hypersensitivity Profile

Genomic Location Trend
These plots show the distribution of the DHS sites surrounding the Transcript Start Site of the nearest gene.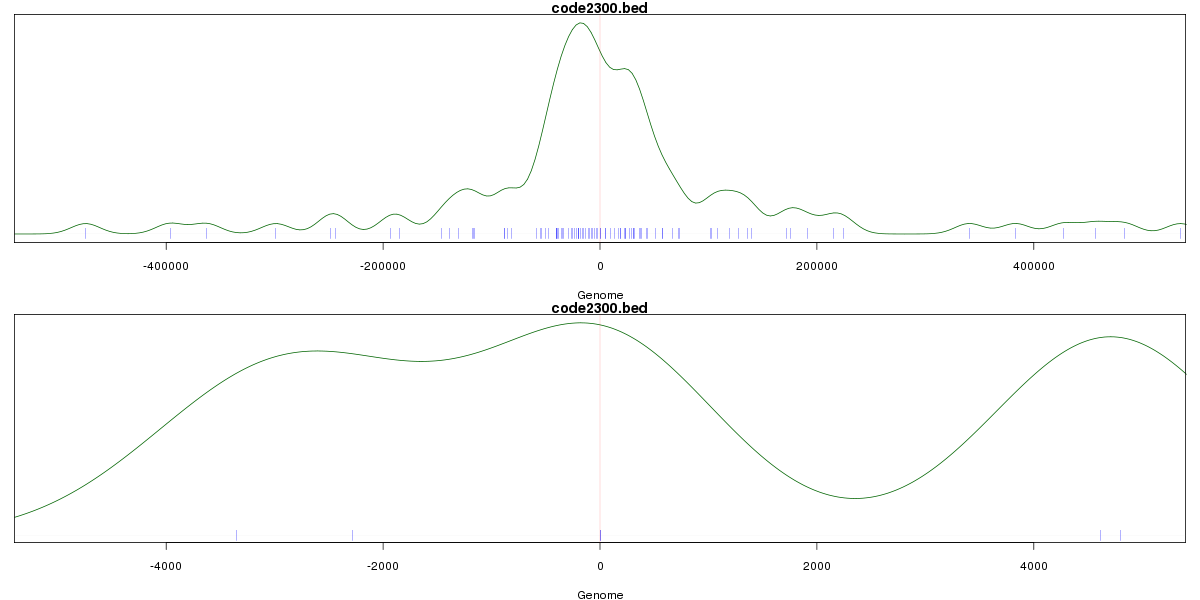
Stats
Number of sites: 724Promoter: 2%
CpG-Island: 0%
Conserved: 29%
Enriched Motifs & Matches
Match Detail: [Jaspar]
|
| ||
|---|---|---|
| Sites: 31/100 | e-val: 2.5e-25 | ||
| Factor | e-val(match) | DB |
| ELK4 | 0.0027561 | JASPAR |
| NFATC2 | 0.0037546 | JASPAR |
| FEV | 0.0046598 | JASPAR |
| SPIB | 0.0077894 | JASPAR |
| FOXO3 | 0.016964 | JASPAR |
BED file downloads
Top 10 Example Regions
| Location | Gene Link | Dist. |
|---|---|---|
| chr1: 145556900-145557050 | NUDT17 | 13.02 |
| chr1: 145556900-145557050 | ANKRD35 | 13.02 |
| chr1: 145556900-145557050 | RP11-315I20.3 | 13.02 |
| chr1: 145556900-145557050 | LIX1L | 13.02 |
| chr1: 150596660-150596810 | MCL1 | 21.53 |
| chr1: 146708965-146709115 | PRKAB2 | 22.08 |
| chr8: 95614540-95614690 | ESRP1 | 23.15 |
| chr2: 28600360-28600510 | AC104695.4 | 38.92 |
| chr2: 112772920-112773070 | TMEM87B | 43.77 |
| chr3: 45008340-45008490 | ZDHHC3 | 43.81 |