SOM cluster: 233
Cluster Hypersensitivity Profile

Genomic Location Trend
These plots show the distribution of the DHS sites surrounding the Transcript Start Site of the nearest gene.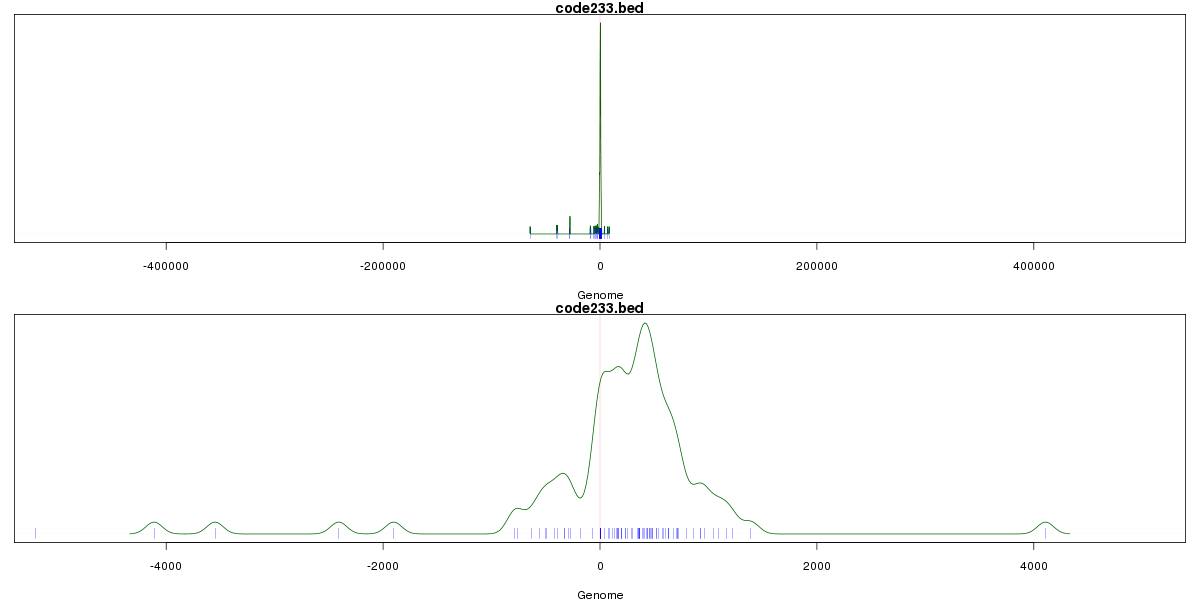
Stats
Number of sites: 185Promoter: 40%
CpG-Island: 78%
Conserved: 51%
Enriched Motifs & Matches
Match Detail: [Jaspar]
|
| ||
|---|---|---|
| Sites: 95/100 | e-val: 0 | ||
| Factor | e-val(match) | DB |
| SP1 | 0.00000001503 | JASPAR |
| TFAP2A | 0.000071556 | JASPAR |
| INSM1 | 0.0010216 | JASPAR |
| Klf4 | 0.003311 | JASPAR |
| Egr1 | 0.007773 | JASPAR |
|
| ||
| Sites: 68/100 | e-val: 2e-16 | ||
| Factor | e-val(match) | DB |
| SP1 | 0.0000085807 | JASPAR |
| Egr1 | 0.0022838 | JASPAR |
| TFAP2A | 0.012069 | JASPAR |
| ELK4 | 0.015296 | JASPAR |
| Klf4 | 0.024531 | JASPAR |
|
| ||
| Sites: 32/100 | e-val: 0.000056 | ||
| Factor | e-val(match) | DB |
| SP1 | 0.00000093565 | JASPAR |
| EWSR1-FLI1 | 0.00039082 | JASPAR |
| MZF1_5-13 | 0.02028 | JASPAR |
| SPIB | 0.037015 | JASPAR |
| PLAG1 | 0.038415 | JASPAR |
BED file downloads
Top 10 Example Regions
| Location | Gene Link | Dist. |
|---|---|---|
| chr6: 41514280-41514430 | FOXP4 | 53.1 |
| chr6: 41514280-41514430 | MDFI | 53.1 |
| chr11: 57226285-57226435 | TIMM10 | 60.49 |
| chr11: 57226285-57226435 | RTN4RL2 | 60.49 |
| chr16: 3109580-3109730 | RP11-473M20.5 | 61.19 |
| chr16: 3109580-3109730 | CLDN9 | 61.19 |
| chr14: 24899660-24899810 | RIPK3 | 62.8 |
| chr14: 24899660-24899810 | RP11-80A15.1 | 62.8 |
| chr16: 128545-128695 | HBZ | 62.93 |
| chr16: 128545-128695 | HBZP1 | 62.93 |