SOM cluster: 2343
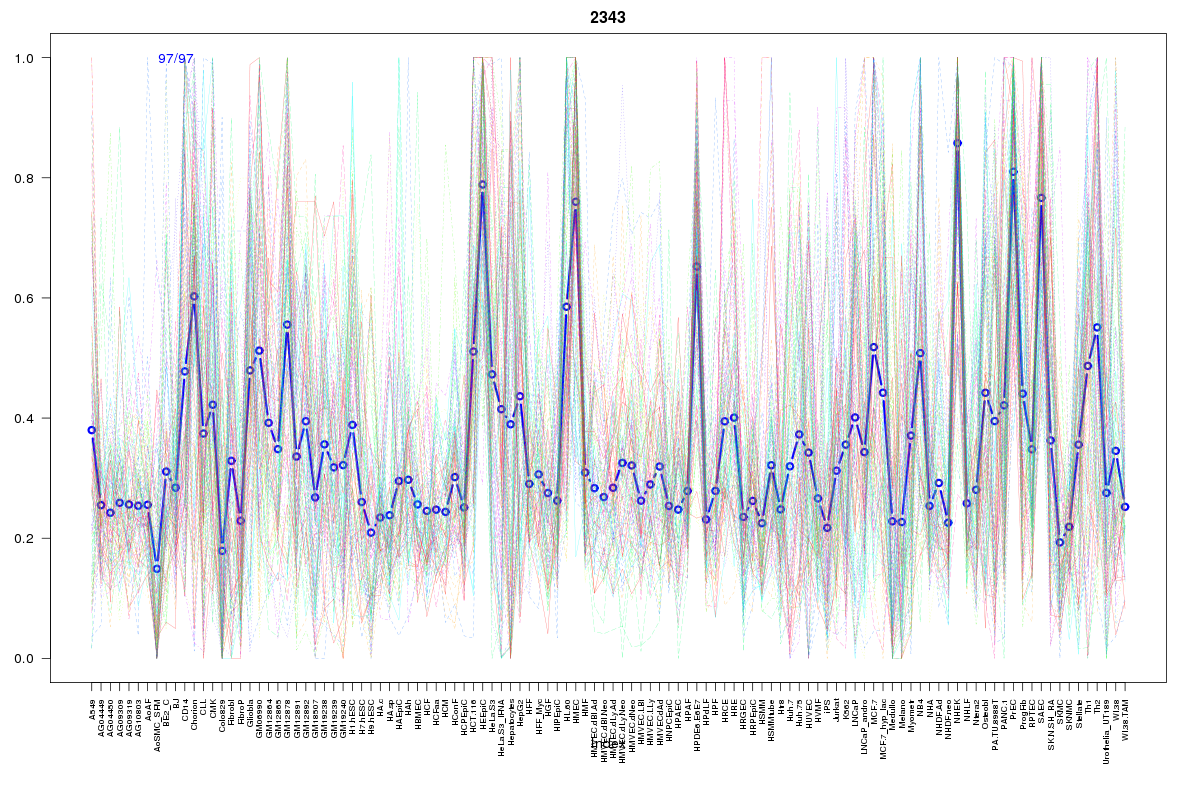
Cluster Hypersensitivity Profile

Genomic Location Trend
These plots show the distribution of the DHS sites surrounding the Transcript Start Site of the nearest gene.
Stats
Number of sites: 97Promoter: 36%
CpG-Island: 32%
Conserved: 58%
Enriched Motifs & Matches
Match Detail: [Jaspar]
|
| ||
|---|---|---|
| Sites: 55/97 | e-val: 0.000036 | ||
| Factor | e-val(match) | DB |
| SP1 | 0.0000043537 | JASPAR |
| TFAP2A | 0.00030655 | JASPAR |
| Zfx | 0.00085106 | JASPAR |
| Klf4 | 0.0030516 | JASPAR |
| MZF1_1-4 | 0.008142 | JASPAR |
|
| ||
| Sites: 57/97 | e-val: 0.0000093 | ||
| Factor | e-val(match) | DB |
| SP1 | 0.00012663 | JASPAR |
| Pax4 | 0.0010536 | JASPAR |
| EWSR1-FLI1 | 0.042541 | JASPAR |
| TFAP2A | 0.042965 | JASPAR |
| MZF1_1-4 | 0.046855 | JASPAR |
|
| ||
| Sites: 23/97 | e-val: 2.3 | ||
| Factor | e-val(match) | DB |
| AP1 | 0.000000000094875 | JASPAR |
| NFE2L2 | 0.00000000013119 | JASPAR |
| Foxa2 | 0.0027639 | JASPAR |
| RORA_2 | 0.0028228 | JASPAR |
| PPARG | 0.0028819 | JASPAR |
BED file downloads
Top 10 Example Regions
| Location | Gene Link | Dist. |
|---|---|---|
| chr2: 71357000-71357150 | PAIP2B | 45.53 |
| chr2: 71357000-71357150 | MPHOSPH10 | 45.53 |
| chr9: 116327805-116327955 | RP11-168K11.2 | 58.5 |
| chr1: 16481600-16481750 | RP11-276H7.2 | 61.48 |
| chr3: 5068460-5068610 | BHLHE40 | 63.67 |
| chr3: 5068460-5068610 | BHLHE40-AS1 | 63.67 |
| chr19: 19739720-19739870 | LPAR2 | 63.99 |
| chr2: 242089540-242089690 | PASK | 66.88 |
| chr2: 242089540-242089690 | SNED1 | 66.88 |
| chr2: 242089540-242089690 | PPP1R7 | 66.88 |