SOM cluster: 2423
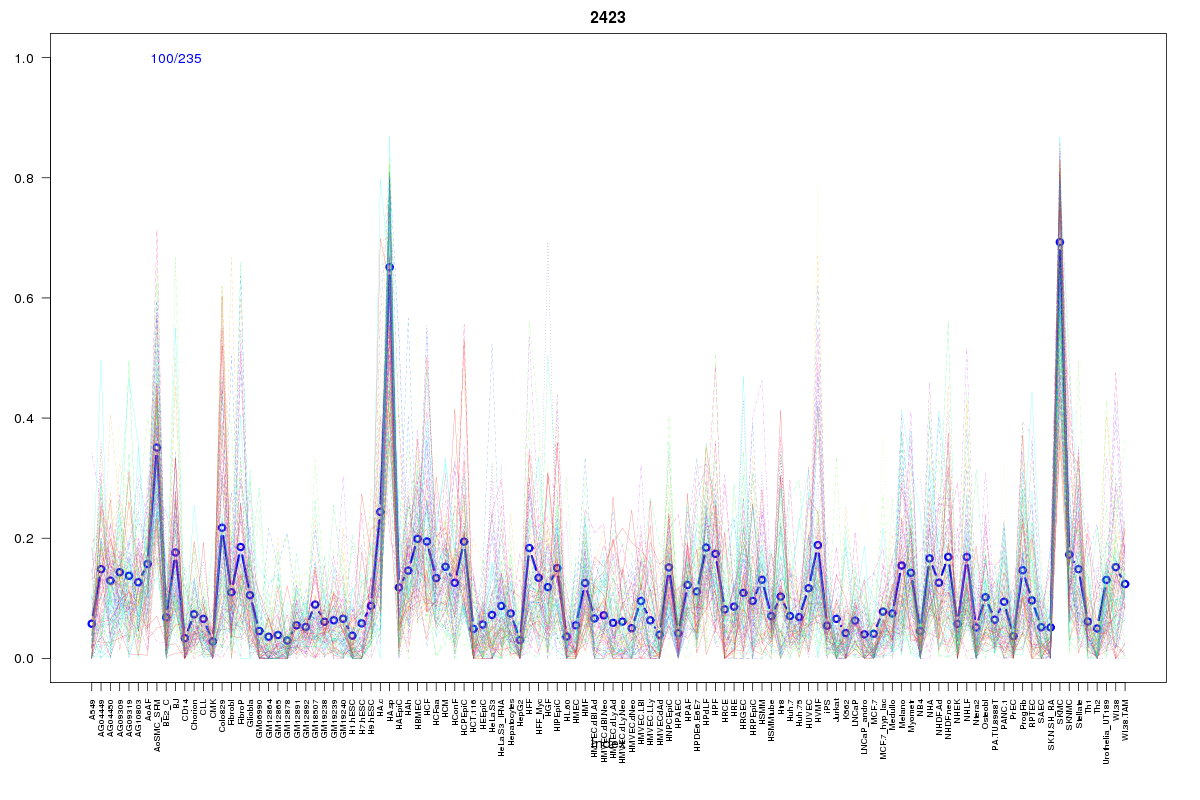
Cluster Hypersensitivity Profile

Genomic Location Trend
These plots show the distribution of the DHS sites surrounding the Transcript Start Site of the nearest gene.
Stats
Number of sites: 235Promoter: 5%
CpG-Island: 1%
Conserved: 49%
Enriched Motifs & Matches
Match Detail: [Jaspar]
|
| ||
|---|---|---|
| Sites: 79/100 | e-val: 4.2e-22 | ||
| Factor | e-val(match) | DB |
| Lhx3 | 0.000061266 | JASPAR |
| HNF1A | 0.00042395 | JASPAR |
| ARID3A | 0.001165 | JASPAR |
| MEF2A | 0.0020033 | JASPAR |
| Prrx2 | 0.0023179 | JASPAR |
BED file downloads
Top 10 Example Regions
| Location | Gene Link | Dist. |
|---|---|---|
| chr8: 77585680-77585830 | ZFHX4-AS1 | 54.22 |
| chr8: 77585680-77585830 | ZFHX4 | 54.22 |
| chr2: 66671880-66672030 | AC092669.1 | 56.32 |
| chr1: 246755880-246756030 | RP11-690C23.4 | 61.88 |
| chr8: 37374645-37374795 | RP11-150O12.6 | 63.33 |
| chr8: 37374645-37374795 | RP11-150O12.2 | 63.33 |
| chr2: 17720860-17721010 | VSNL1 | 68.77 |
| chr7: 116228820-116228970 | CAV1 | 69.4 |
| chr7: 116228820-116228970 | CAV2 | 69.4 |
| chr5: 67548380-67548530 | PIK3R1 | 70.22 |