SOM cluster: 2497
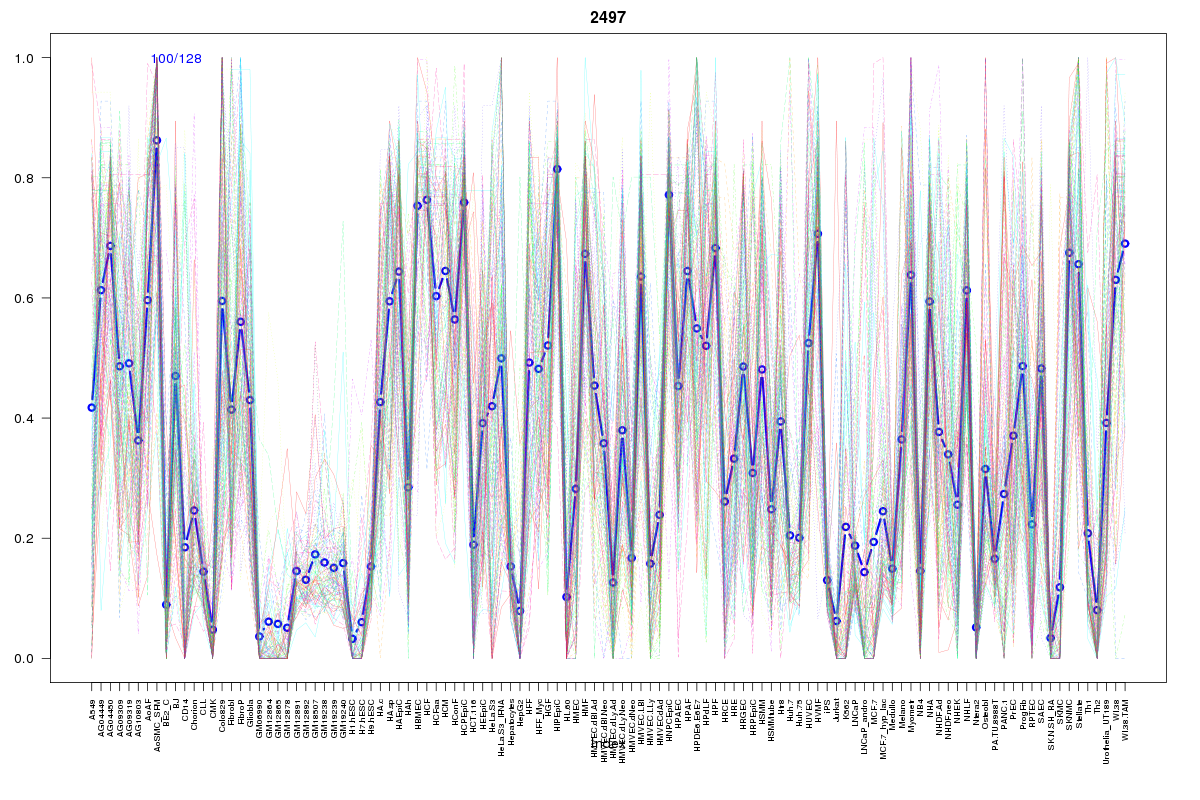
Cluster Hypersensitivity Profile

Genomic Location Trend
These plots show the distribution of the DHS sites surrounding the Transcript Start Site of the nearest gene.
Stats
Number of sites: 128Promoter: 2%
CpG-Island: 0%
Conserved: 44%
Enriched Motifs & Matches
Match Detail: [Jaspar]
|
| ||
|---|---|---|
| Sites: 46/100 | e-val: 2.6e-31 | ||
| Factor | e-val(match) | DB |
| AP1 | 0.0000000010439 | JASPAR |
| NFE2L2 | 0.000001123 | JASPAR |
| PBX1 | 0.005756 | JASPAR |
| NFE2L1::MafG | 0.013152 | JASPAR |
| PPARG | 0.039703 | JASPAR |
|
| ||
| Sites: 22/100 | e-val: 0.000076 | ||
| Factor | e-val(match) | DB |
| Foxd3 | 0.0002131 | JASPAR |
| Evi1 | 0.00052405 | JASPAR |
| FOXI1 | 0.0047639 | JASPAR |
| FOXA1 | 0.0052551 | JASPAR |
| MEF2A | 0.0072463 | JASPAR |
BED file downloads
Top 10 Example Regions
| Location | Gene Link | Dist. |
|---|---|---|
| chr3: 141130960-141131110 | ZBTB38 | 40.21 |
| chr3: 25623840-25623990 | RARB | 51.98 |
| chr12: 24192080-24192230 | SOX5 | 54.99 |
| chr12: 46068560-46068710 | RP11-352M15.1 | 55.88 |
| chr6: 52913240-52913390 | GCM1 | 64.25 |
| chr6: 52913240-52913390 | GSTA4 | 64.25 |
| chr6: 52913240-52913390 | ICK | 64.25 |
| chr7: 23470320-23470470 | AC021876.4 | 66.66 |
| chr8: 89282260-89282410 | MMP16 | 67.94 |
| chr8: 89282260-89282410 | RP11-586K2.1 | 67.94 |