SOM cluster: 254
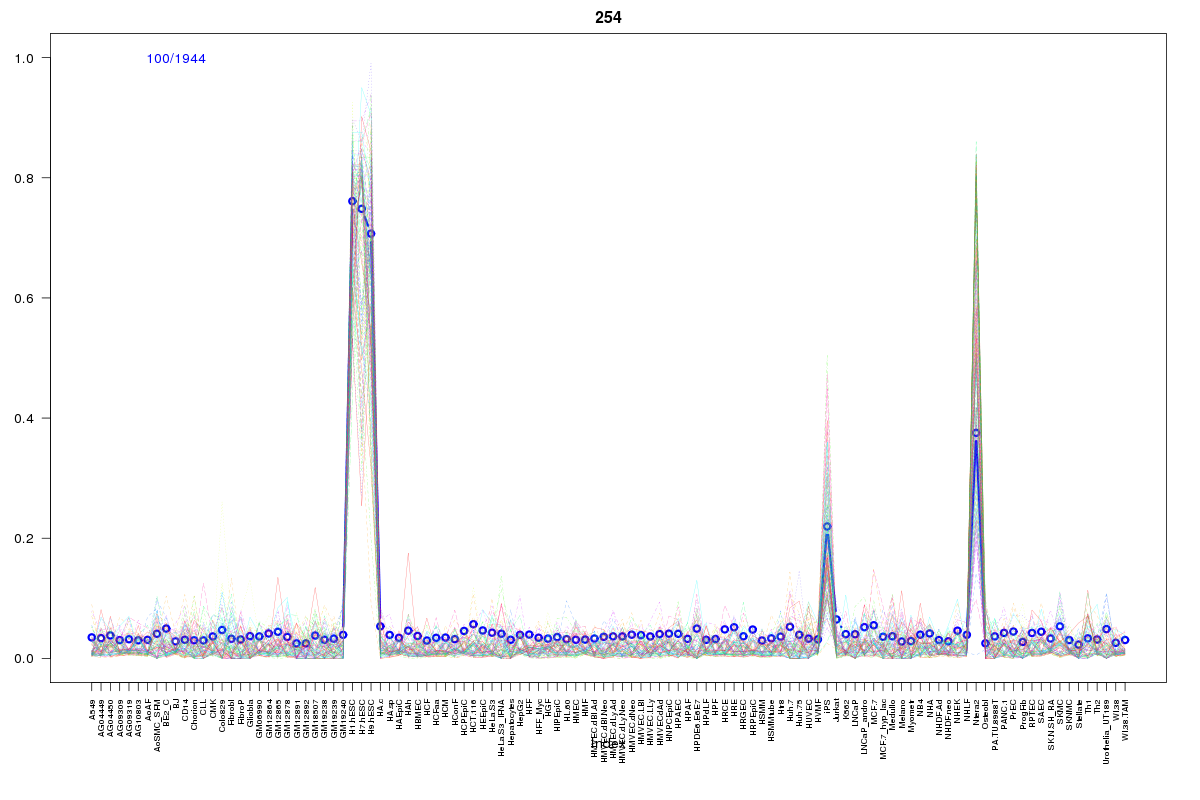
Cluster Hypersensitivity Profile

Genomic Location Trend
These plots show the distribution of the DHS sites surrounding the Transcript Start Site of the nearest gene.
Stats
Number of sites: 1944Promoter: 1%
CpG-Island: 0%
Conserved: 27%
Enriched Motifs & Matches
Match Detail: [Jaspar]
|
| ||
|---|---|---|
| Sites: 19/100 | e-val: 0.00000059 | ||
| Factor | e-val(match) | DB |
| Pou5f1 | 0 | JASPAR |
| Sox2 | 0 | JASPAR |
| SOX10 | 0.0000016637 | JASPAR |
| SOX9 | 0.000053796 | JASPAR |
| HLF | 0.0015227 | JASPAR |
BED file downloads
Top 10 Example Regions
| Location | Gene Link | Dist. |
|---|---|---|
| chr1: 145487260-145487410 | PEX11B | 29.51 |
| chr1: 145487260-145487410 | LIX1L | 29.51 |
| chr1: 145487260-145487410 | ANKRD34A | 29.51 |
| chr1: 145487260-145487410 | POLR3GL | 29.51 |
| chr1: 39467280-39467430 | AKIRIN1 | 51.37 |
| chr10: 123356485-123356635 | FGFR2 | 51.75 |
| chrX: 130611540-130611690 | OR13K1P | 51.88 |
| chrX: 130611540-130611690 | RP1-154J13.2 | 51.88 |
| chr8: 54230880-54231030 | OPRK1 | 53.9 |
| chr12: 21367440-21367590 | SLCO1A2 | 54.15 |