SOM cluster: 265
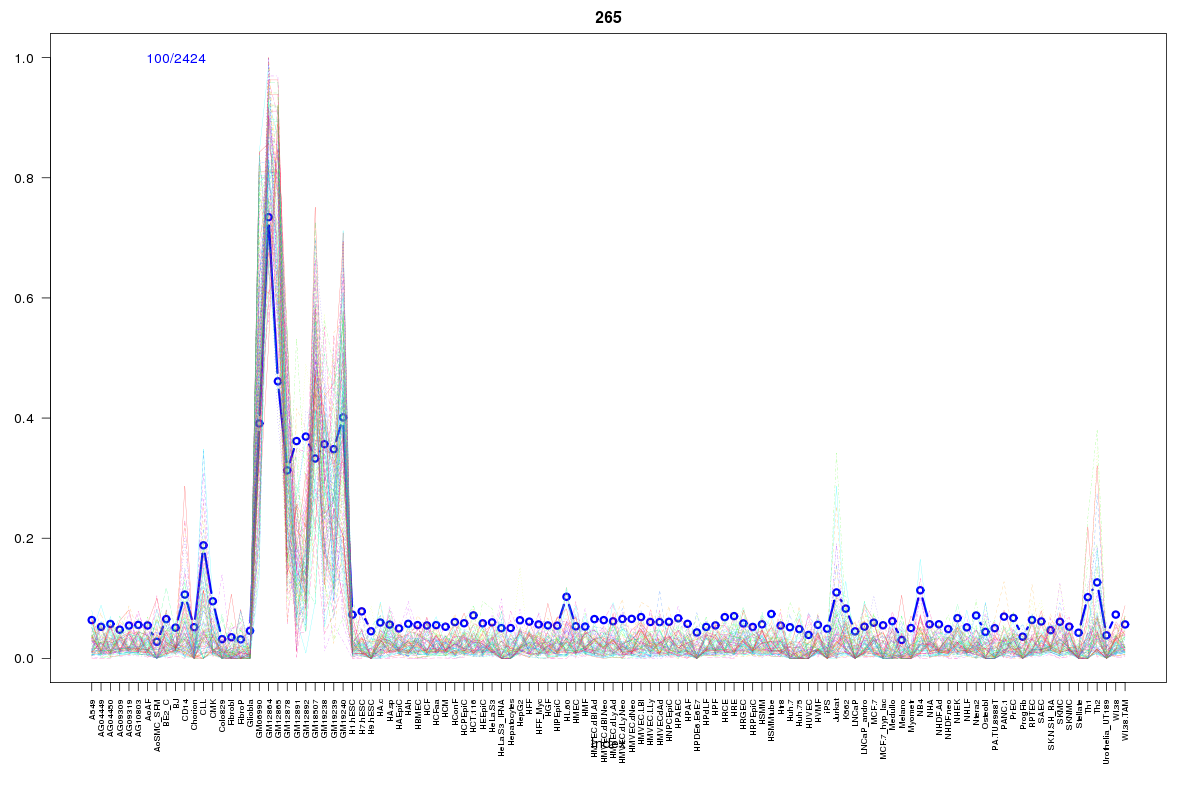
Cluster Hypersensitivity Profile

Genomic Location Trend
These plots show the distribution of the DHS sites surrounding the Transcript Start Site of the nearest gene.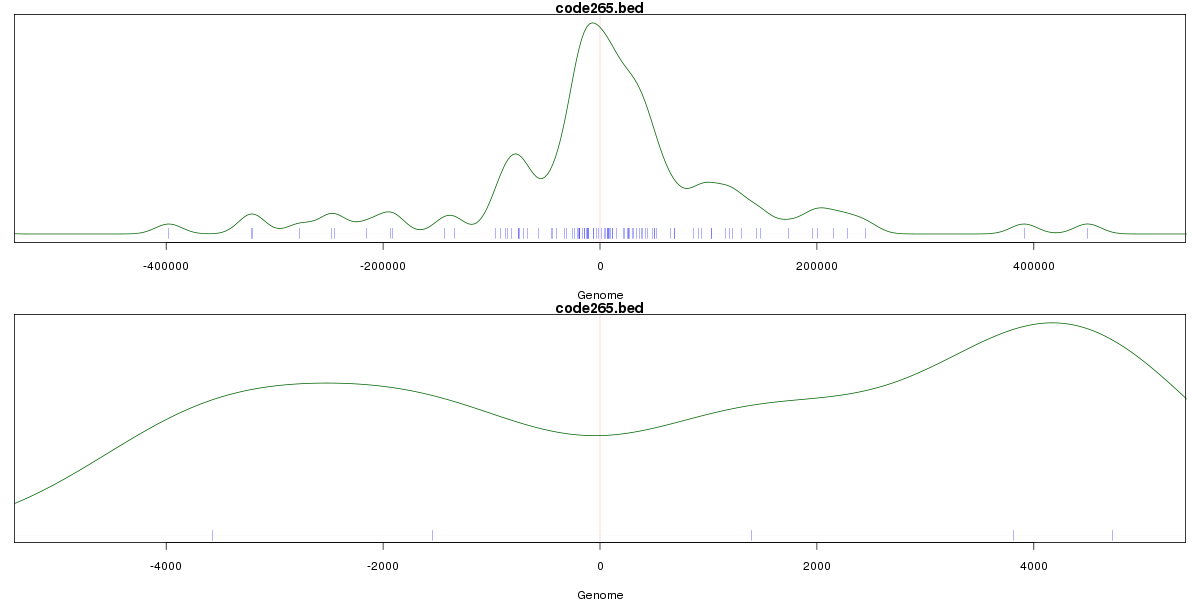
Stats
Number of sites: 2424Promoter: 1%
CpG-Island: 0%
Conserved: 25%
Enriched Motifs & Matches
Match Detail: [Jaspar]
|
| ||
|---|---|---|
| Sites: 41/100 | e-val: 0.0000000045 | ||
| Factor | e-val(match) | DB |
| IRF1 | 0.00011523 | JASPAR |
| Foxd3 | 0.0049483 | JASPAR |
| Foxq1 | 0.0092443 | JASPAR |
| IRF2 | 0.016079 | JASPAR |
| Pax4 | 0.023398 | JASPAR |