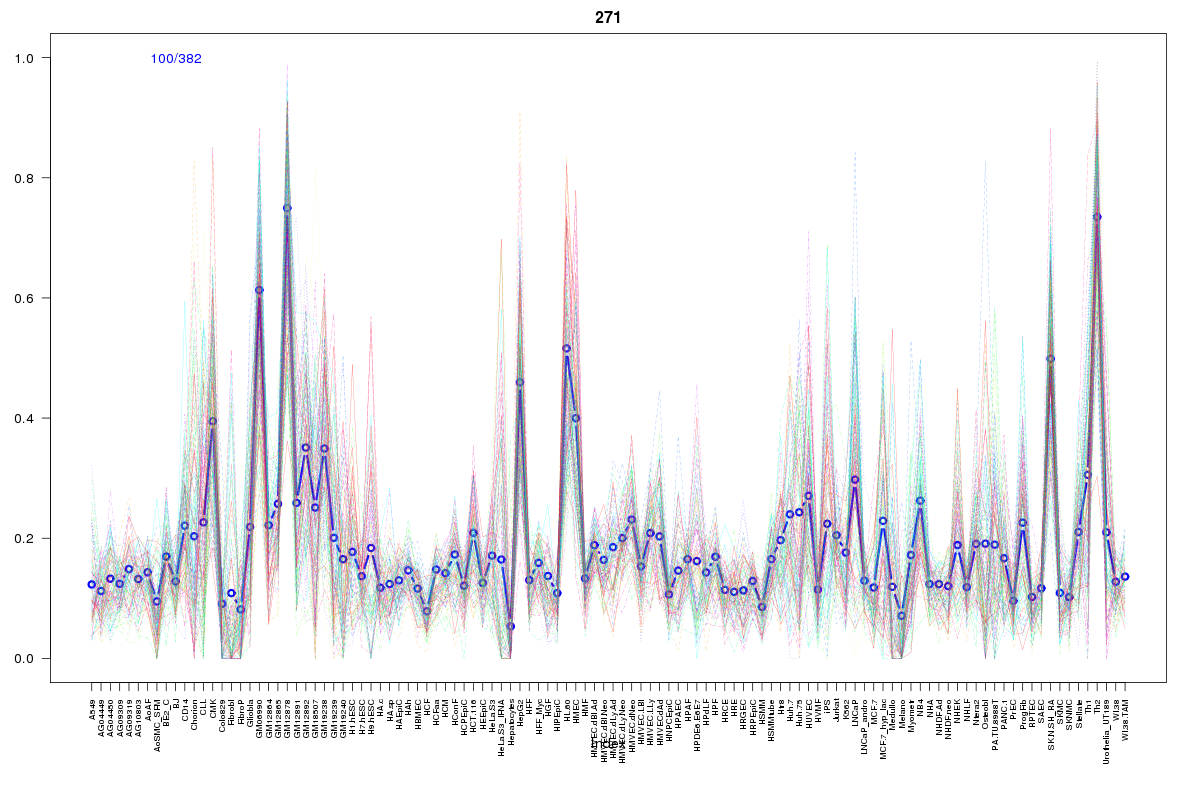
SOM cluster: 271
Cluster Hypersensitivity Profile

Genomic Location Trend
These plots show the distribution of the DHS sites surrounding the Transcript Start Site of the nearest gene.
Stats
Number of sites: 382Promoter: 21%
CpG-Island: 96%
Conserved: 70%
Enriched Motifs & Matches
Match Detail: [Jaspar]
|
| ||
|---|---|---|
| Sites: 99/100 | e-val: 0 | ||
| Factor | e-val(match) | DB |
| SP1 | 0.0039656 | JASPAR |
| TFAP2A | 0.01225 | JASPAR |
| PLAG1 | 0.02976 | JASPAR |
| Egr1 | 0.040989 | JASPAR |
| CTCF | 0.071416 | JASPAR |
|
| ||
| Sites: 89/100 | e-val: 1.9e-36 | ||
| Factor | e-val(match) | DB |
| SP1 | 0.000039128 | JASPAR |
| RREB1 | 0.0011097 | JASPAR |
| TFAP2A | 0.0041934 | JASPAR |
| Klf4 | 0.01016 | JASPAR |
| PLAG1 | 0.013913 | JASPAR |
BED file downloads
Top 10 Example Regions
| Location | Gene Link | Dist. |
|---|---|---|
| chr1: 161696020-161696170 | DUSP12 | 38.52 |
| chr12: 120632200-120632350 | RPLP0 | 39.91 |
| chr12: 120632200-120632350 | PXN-AS1 | 39.91 |
| chr10: 30723185-30723335 | MAP3K8 | 41.76 |
| chr8: 124169100-124169250 | FAM83A-AS1 | 48.22 |
| chr17: 76123860-76124010 | BIRC5 | 49.13 |
| chr17: 76123860-76124010 | TMC6 | 49.13 |
| chr17: 76123860-76124010 | TK1 | 49.13 |
| chr17: 76123860-76124010 | AFMID | 49.13 |
| chr17: 76182825-76182975 | SYNGR2 | 50.75 |