SOM cluster: 286
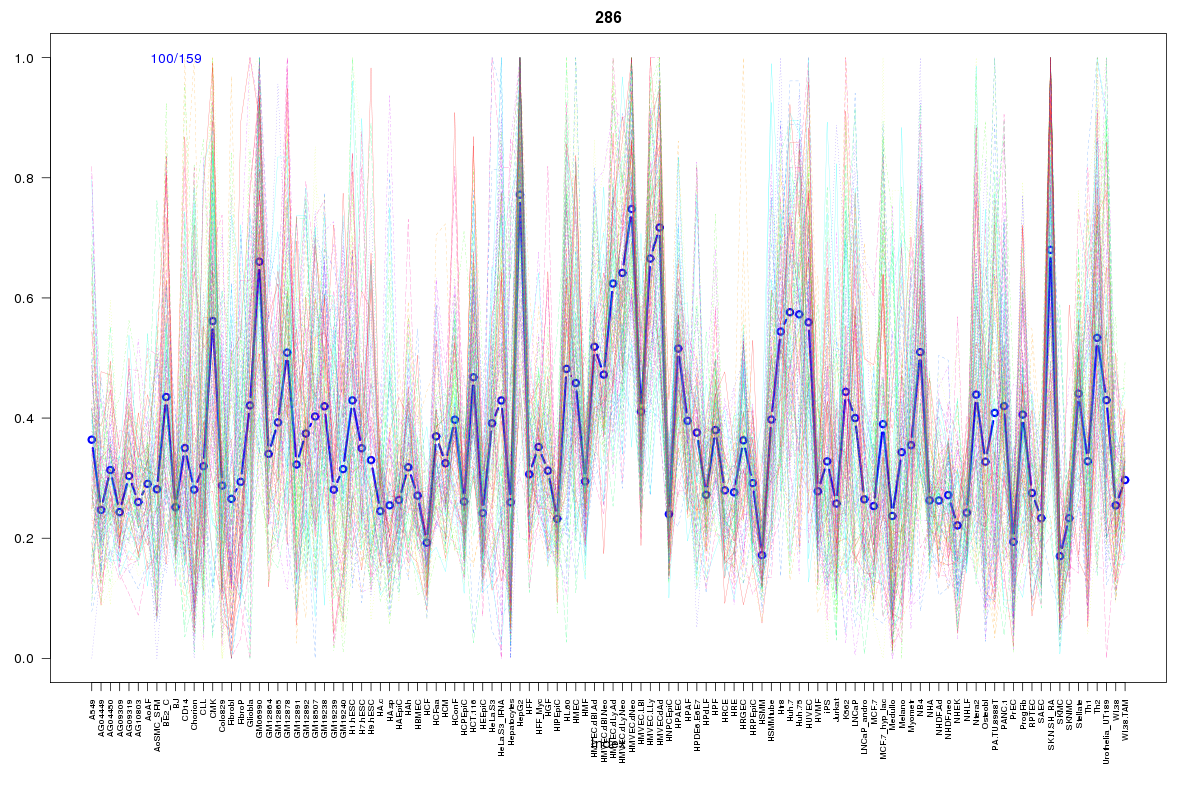
Cluster Hypersensitivity Profile

Genomic Location Trend
These plots show the distribution of the DHS sites surrounding the Transcript Start Site of the nearest gene.
Stats
Number of sites: 159Promoter: 37%
CpG-Island: 72%
Conserved: 60%
Enriched Motifs & Matches
Match Detail: [Jaspar]
|
| ||
|---|---|---|
| Sites: 98/100 | e-val: 0 | ||
| Factor | e-val(match) | DB |
| SP1 | 0.000020232 | JASPAR |
| TFAP2A | 0.00050152 | JASPAR |
| PLAG1 | 0.0071425 | JASPAR |
| Zfx | 0.012019 | JASPAR |
| Klf4 | 0.029179 | JASPAR |
|
| ||
| Sites: 56/100 | e-val: 0.0000000000000019 | ||
| Factor | e-val(match) | DB |
| SP1 | 0.00000010919 | JASPAR |
| PLAG1 | 0.00003802 | JASPAR |
| TFAP2A | 0.00038586 | JASPAR |
| Zfp423 | 0.0028394 | JASPAR |
| RREB1 | 0.0038855 | JASPAR |
BED file downloads
Top 10 Example Regions
| Location | Gene Link | Dist. |
|---|---|---|
| chr9: 139407360-139407510 | NOTCH1 | 52.26 |
| chr11: 63742480-63742630 | RCOR2 | 53.34 |
| chr9: 35162220-35162370 | UNC13B | 55.6 |
| chr6: 28193105-28193255 | ZSCAN9 | 56.89 |
| chr3: 43327760-43327910 | RN7SL517P | 58.53 |
| chr3: 43327760-43327910 | SNRK | 58.53 |
| chr8: 56793145-56793295 | LYN | 64.71 |
| chr5: 132202520-132202670 | UQCRQ | 66.7 |
| chr5: 132202520-132202670 | LEAP2 | 66.7 |
| chr5: 132202520-132202670 | AC010240.2 | 66.7 |