SOM cluster: 327
Cluster Hypersensitivity Profile

Genomic Location Trend
These plots show the distribution of the DHS sites surrounding the Transcript Start Site of the nearest gene.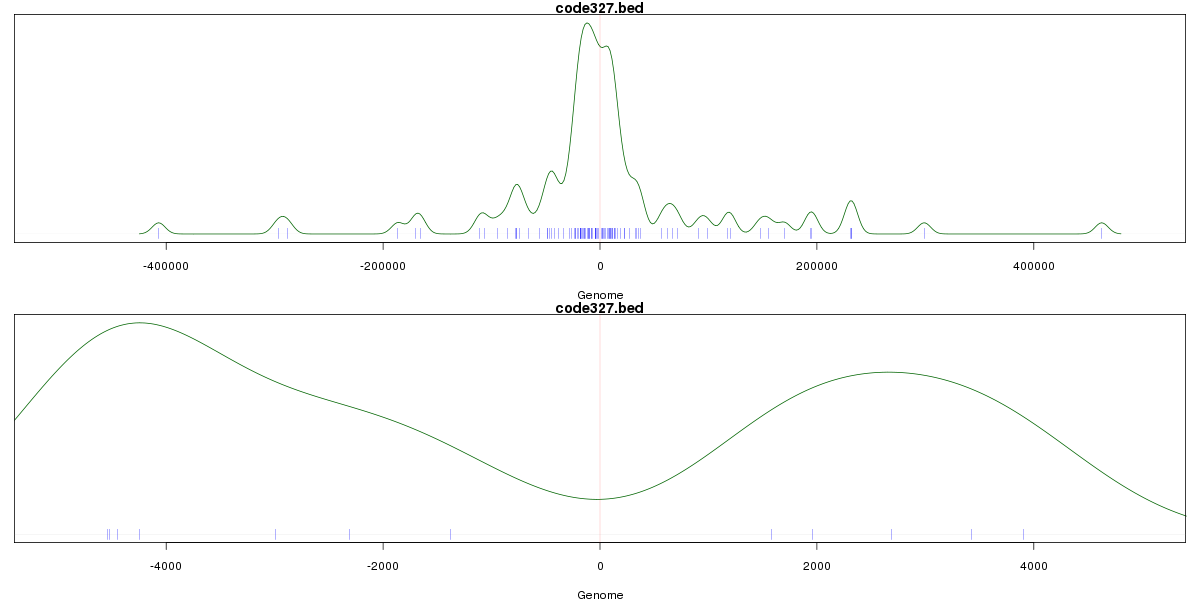
Stats
Number of sites: 911Promoter: 1%
CpG-Island: 0%
Conserved: 21%
Enriched Motifs & Matches
Match Detail: [Jaspar]
|
| ||
|---|---|---|
| Sites: 21/100 | e-val: 0.0000011 | ||
| Factor | e-val(match) | DB |
| SPIB | 0.00000016166 | JASPAR |
| SPI1 | 0.000033111 | JASPAR |
| IRF1 | 0.000096646 | JASPAR |
| EWSR1-FLI1 | 0.00011621 | JASPAR |
| IRF2 | 0.00044783 | JASPAR |
BED file downloads
Top 10 Example Regions
| Location | Gene Link | Dist. |
|---|---|---|
| chr1: 146717460-146717610 | PRKAB2 | 26.56 |
| chr17: 76907100-76907250 | LGALS3BP | 39.16 |
| chr3: 46150420-46150570 | CCR1 | 42.6 |
| chr19: 47892100-47892250 | SLC8A2 | 44.61 |
| chr19: 47892100-47892250 | C5AR1 | 44.61 |
| chr9: 97416900-97417050 | FBP1 | 46.22 |
| chr9: 134391600-134391750 | PRRC2B | 46.31 |
| chr9: 134391600-134391750 | UCK1 | 46.31 |
| chrX: 65269960-65270110 | VSIG4 | 47.94 |
| chrX: 65269960-65270110 | MIR223 | 47.94 |