SOM cluster: 367
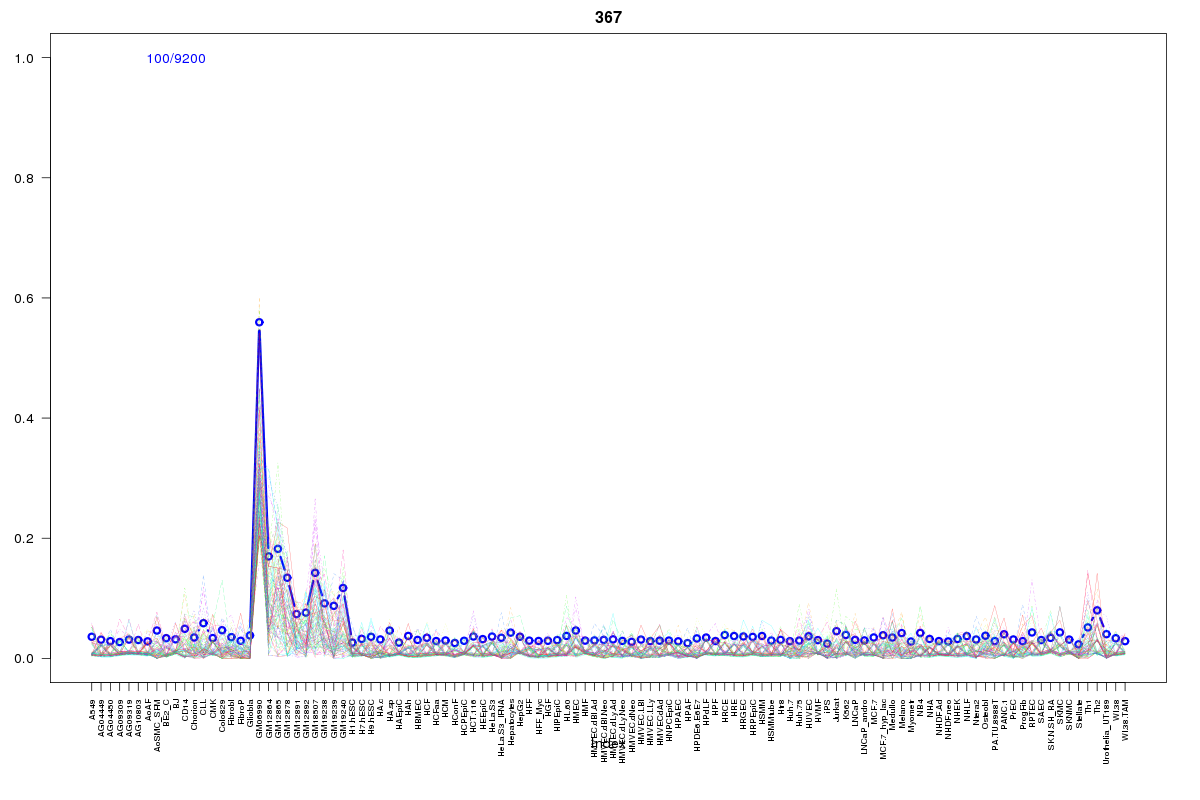
Cluster Hypersensitivity Profile

Genomic Location Trend
These plots show the distribution of the DHS sites surrounding the Transcript Start Site of the nearest gene.
Stats
Number of sites: 9200Promoter: 1%
CpG-Island: 0%
Conserved: 7%
Enriched Motifs & Matches
Match Detail: [Jaspar]
|
| ||
|---|---|---|
| Sites: 29/100 | e-val: 0.000000000000028 | ||
| Factor | e-val(match) | DB |
| Lhx3 | 0.000063072 | JASPAR |
| Foxd3 | 0.000092113 | JASPAR |
| Foxq1 | 0.0019858 | JASPAR |
| FOXI1 | 0.00629 | JASPAR |
| MEF2A | 0.0065216 | JASPAR |
BED file downloads
Top 10 Example Regions
| Location | Gene Link | Dist. |
|---|---|---|
| chr1: 145606325-145606475 | RBM8A | 13.02 |
| chr1: 145606325-145606475 | ITGA10 | 13.02 |
| chr1: 145606325-145606475 | PIAS3 | 13.02 |
| chr1: 150137280-150137430 | PLEKHO1 | 14.06 |
| chr10: 26662200-26662350 | APBB1IP | 27.72 |
| chr3: 186239620-186239770 | RP11-48F14.2 | 30.79 |
| chr8: 101545320-101545470 | KB-1083B1.1 | 33.07 |
| chr4: 2105660-2105810 | POLN | 37.21 |
| chr8: 49430340-49430490 | RP11-770E5.1 | 37.86 |
| chr8: 49430340-49430490 | RP11-567J20.2 | 37.86 |