SOM cluster: 371
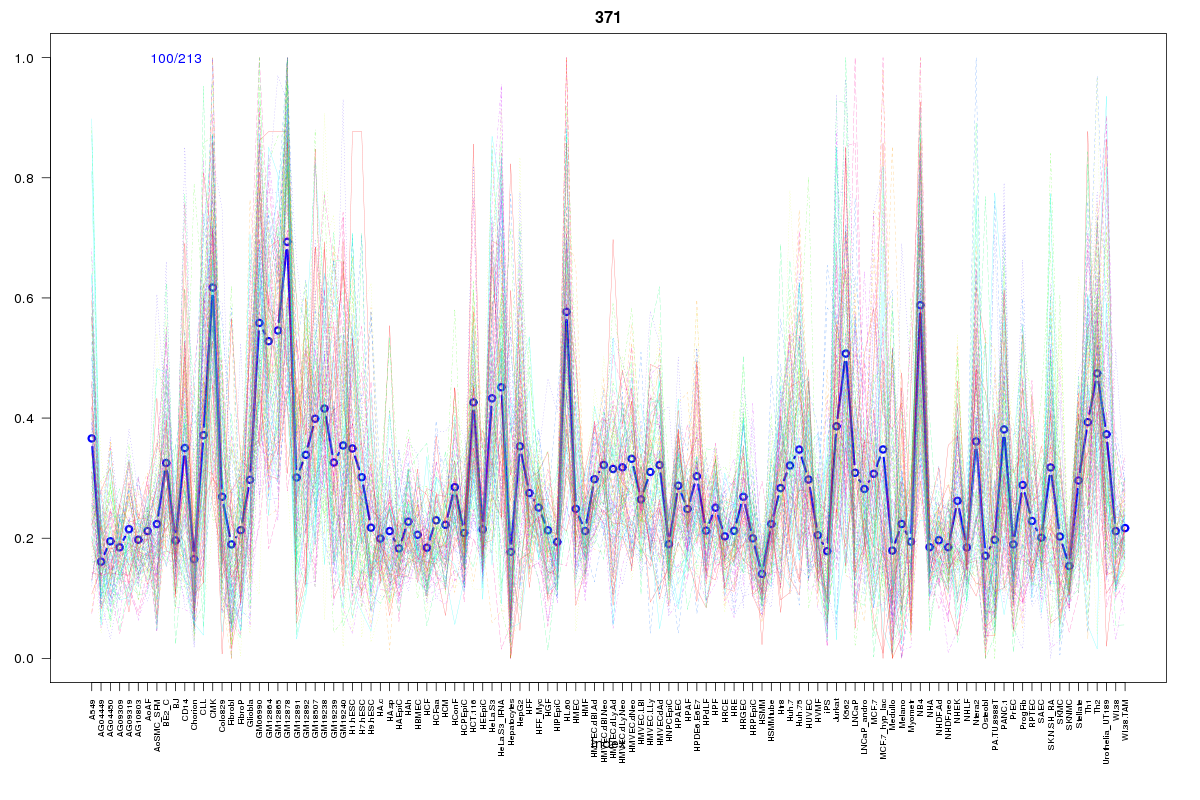
Cluster Hypersensitivity Profile

Genomic Location Trend
These plots show the distribution of the DHS sites surrounding the Transcript Start Site of the nearest gene.
Stats
Number of sites: 213Promoter: 32%
CpG-Island: 36%
Conserved: 40%
Enriched Motifs & Matches
Match Detail: [Jaspar]
|
| ||
|---|---|---|
| Sites: 47/100 | e-val: 1.3 | ||
| Factor | e-val(match) | DB |
| SP1 | 0.0000012501 | JASPAR |
| INSM1 | 0.00056262 | JASPAR |
| Klf4 | 0.0023815 | JASPAR |
| EWSR1-FLI1 | 0.011401 | JASPAR |
| Myb | 0.014713 | JASPAR |
BED file downloads
Top 10 Example Regions
| Location | Gene Link | Dist. |
|---|---|---|
| chr2: 26569580-26569730 | EPT1 | 50.53 |
| chr4: 17513300-17513450 | LAP3 | 57.79 |
| chrX: 13671580-13671730 | TRAPPC2 | 59.02 |
| chrX: 13671580-13671730 | EGFL6 | 59.02 |
| chrX: 13671580-13671730 | OFD1 | 59.02 |
| chrX: 13671580-13671730 | RAB9A | 59.02 |
| chr1: 33283920-33284070 | YARS | 60.53 |
| chr12: 109490720-109490870 | RP11-968O1.5 | 60.67 |
| chr12: 109490720-109490870 | USP30-AS1 | 60.67 |
| chr17: 40687825-40687975 | PSMC3IP | 63.47 |