SOM cluster: 388
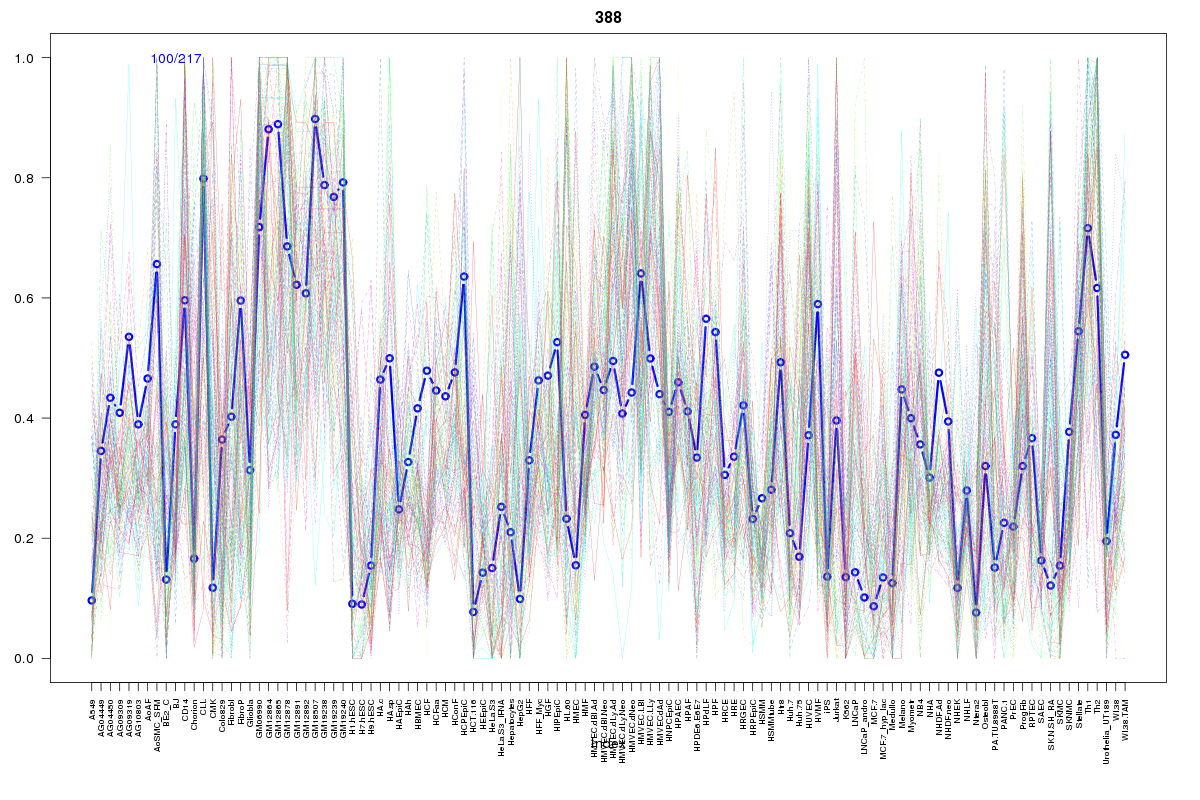
Cluster Hypersensitivity Profile

Genomic Location Trend
These plots show the distribution of the DHS sites surrounding the Transcript Start Site of the nearest gene.
Stats
Number of sites: 217Promoter: 34%
CpG-Island: 58%
Conserved: 67%
Enriched Motifs & Matches
Match Detail: [Jaspar]
|
| ||
|---|---|---|
| Sites: 31/100 | e-val: 5.2e-33 | ||
| Factor | e-val(match) | DB |
| IRF2 | 0.000000000000040301 | JASPAR |
| IRF1 | 0.000000000000085265 | JASPAR |
| ELK4 | 0.00056373 | JASPAR |
| GABPA | 0.006338 | JASPAR |
| FOXA1 | 0.007613 | JASPAR |
|
| ||
| Sites: 53/100 | e-val: 0.00000000022 | ||
| Factor | e-val(match) | DB |
| SP1 | 0.00021198 | JASPAR |
| TFAP2A | 0.00045404 | JASPAR |
| Klf4 | 0.0048719 | JASPAR |
| Egr1 | 0.01721 | JASPAR |
| PLAG1 | 0.11265 | JASPAR |
BED file downloads
Top 10 Example Regions
| Location | Gene Link | Dist. |
|---|---|---|
| chr10: 22919660-22919810 | PIP4K2A | 31.35 |
| chr2: 30448080-30448230 | LBH | 50.62 |
| chr2: 30448080-30448230 | AC104698.1 | 50.62 |
| chr19: 54617920-54618070 | TSEN34 | 52.3 |
| chr19: 54617920-54618070 | TFPT | 52.3 |
| chr19: 54617920-54618070 | TMC4 | 52.3 |
| chr11: 47788180-47788330 | FNBP4 | 58.11 |
| chr3: 36986500-36986650 | TRANK1 | 60.43 |
| chr13: 41238400-41238550 | FOXO1 | 63.31 |
| chr1: 207999120-207999270 | C1orf132 | 64.05 |